Measure for React Native
Measure is an open source, mobile first monitoring platform built for React Native. Whether you use vanilla React Native or Expo, Hermes or JavaScriptCore, Measure gives you the full context behind every error across your JavaScript and native layers, so you can cut crash rates, tighten performance and ship a smoother experience on both Android and iOS.

Session Timelines
Every error in your React Native app arrives with a complete Session Timeline. Replay the exact path to the issue — gestures, navigation, network calls, logs and lifecycle events — with CPU and memory readings right alongside.
Rather than piecing together a minified stack trace, you see exactly what the user did and how the app behaved in the moments before it broke.
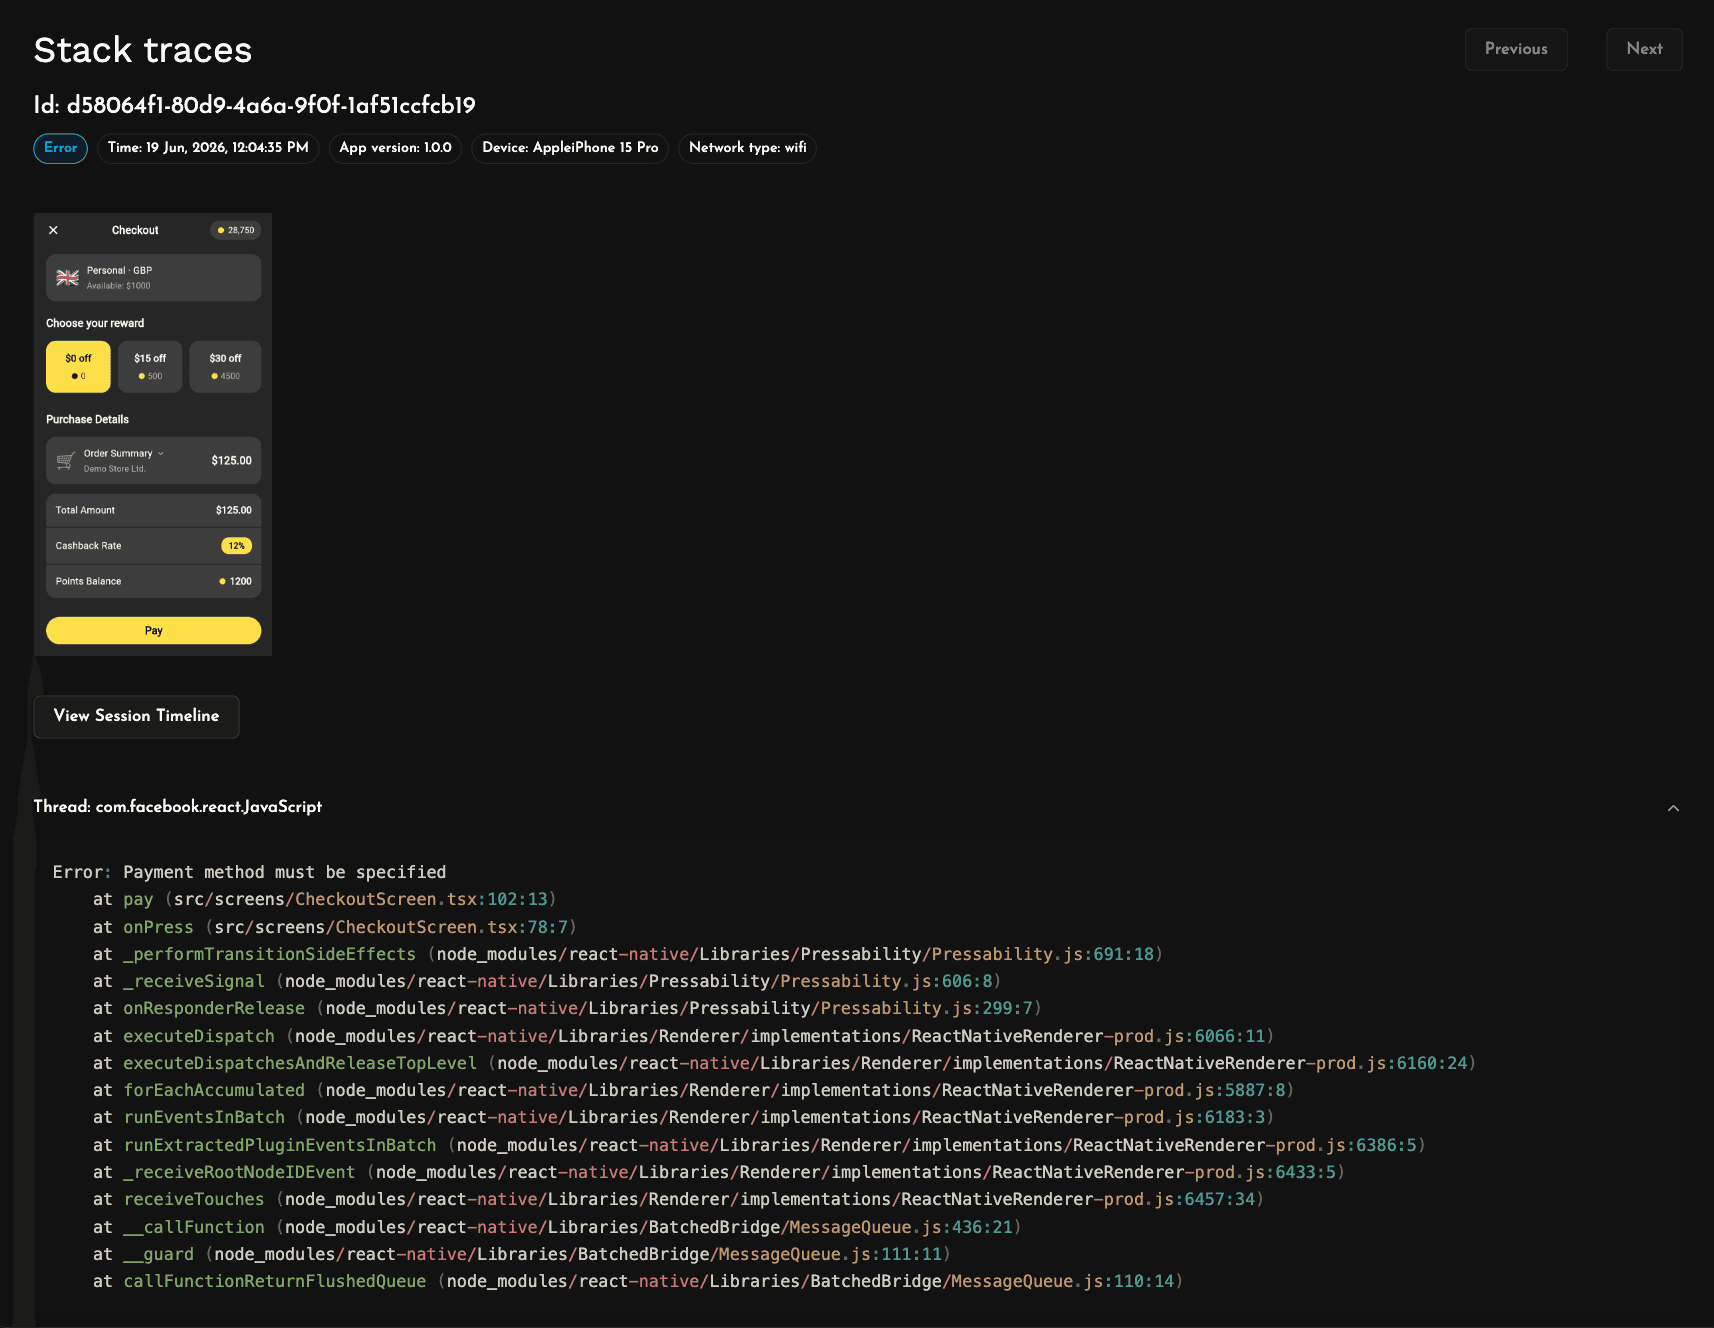
Detailed Stack Traces
Every crash and error comes with a complete stack trace. JavaScript errors are symbolicated from your sourcemaps, so you read your own functions, files and line numbers instead of minified output, and crashes from the native Android and iOS layers are captured and mapped too.
Sourcemaps and native mapping files are uploaded automatically, so you can let Measure take care of the boring stuff and focus on fixing user issues.

Performance Monitoring
Put traces around the operations that matter with Performance Traces. See how network requests, native modules, expensive JavaScript and screen rendering stack up within a single user flow or across millions of sessions with waterfall charts that make bottlenecks obvious.
Each trace carries rich device and app context and links back to the full session timeline, so a slow operation always comes with the environment it ran in.

App Health
Stay on top of every release with App Health. Track adoption, crash-free sessions, app size, and launch times for your Android and iOS builds alike.
Spot a bad rollout early and fix it before it reaches the rest of your users.

Bug Reports
Let users flag problems the moment they hit them with Bug Reports, triggered by a device shake or a call to the SDK from your own button. Each report bundles device details, app version, network conditions and screenshots with the user's own words, with an easy link straight to the matching session timeline.
Skip the email threads and support ticket back-and-forth. Your users describe the issue and you get all the context you need to solve it.

User Journeys
See the paths users take through your app with User Journeys. Every screen transition is mapped automatically into clear flow diagrams, and the exception view shows where issues interrupt those flows.
Short on time? See which paths matter most to your users so you can prioritize issues by user traffic.

Network Monitoring
Watch every request your app makes with Network Performance. Track HTTP status codes over time and drill into your top endpoints, ranked by latency, error rate and request volume, to find the calls slowing your app down.
Catch degraded endpoints early and tune the API calls that matter most to your users.


Coding Agents
Bring all of Measure's context into the coding agents you already use. The Measure MCP server gives any agent access to your crashes, errors, performance traces and session timelines, straight from your IDE, editor or terminal.
Have it dig into a crash, work through user sessions, or wire it into an agentic triage and debugging pipeline. Whether you lean on Claude Code or Codex, or prefer open source agents and models, Measure fits right into your workflow.