Measure for Flutter
Measure is an open source, mobile first monitoring platform built for Flutter. It brings together the full context behind every crash and error across your Dart and native code, so you can drive down crash and error rates, smooth out performance issues and deliver a delightful experience on both Android and iOS.

Session Timelines
Every crash and error in your Flutter app comes with a complete Session Timeline you can replay. Step back through the exact lead-up — gestures, navigation, network calls, logs and lifecycle events — with CPU and memory readings plotted right beside them.
Instead of reading an out-of-context Dart stack trace, you can see exactly what the user did and how the app responded just before things went wrong.
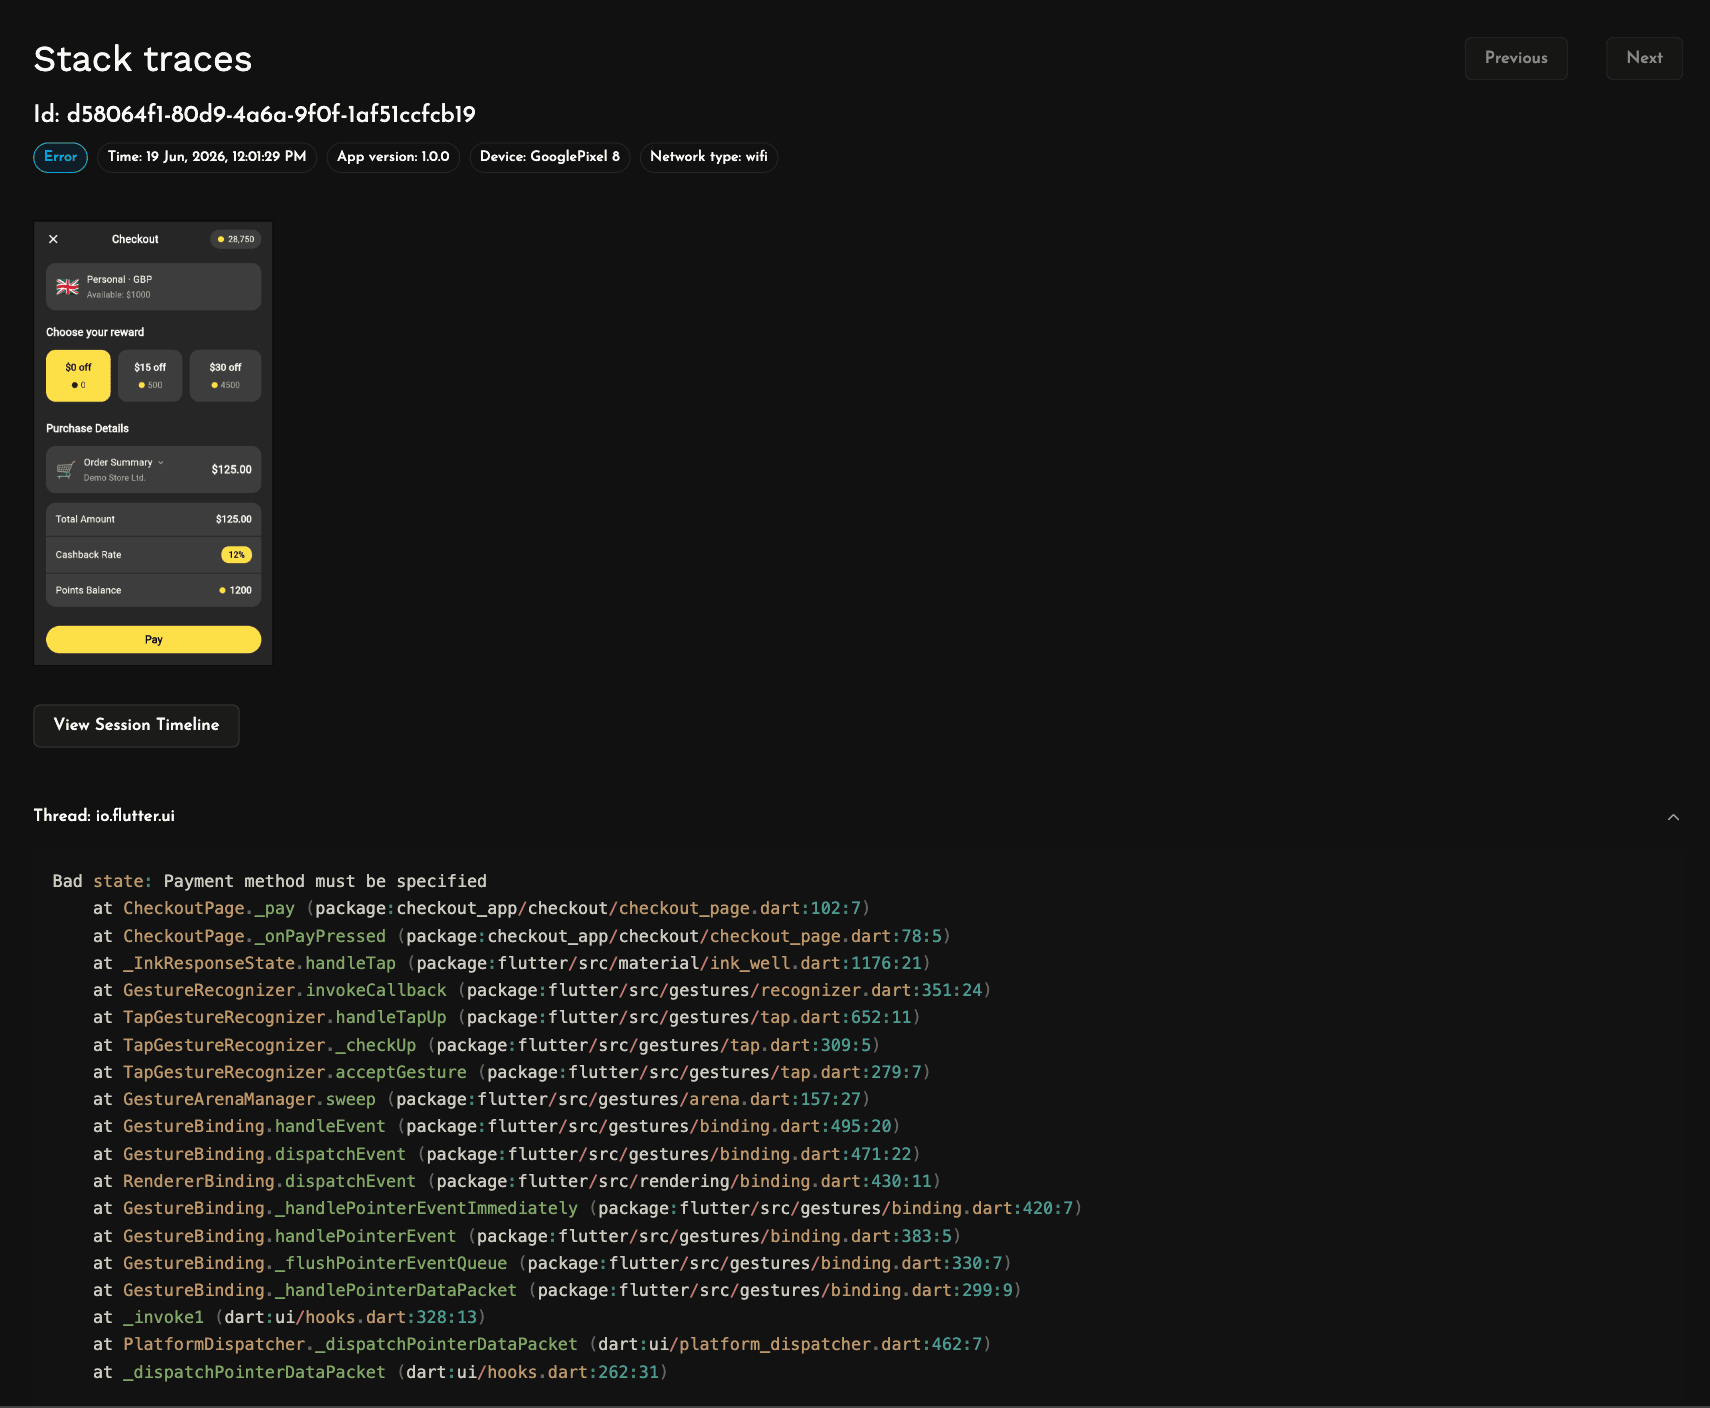
Detailed Stack Traces
Every crash and error carries a complete Dart stack trace, alongside any native crash from the Android or iOS side.
Stack traces are automatically deobfuscated, mapping both native and Dart code to your original class and method names with their intact line numbers. Let Measure deal with the tedious part so you can focus on debugging issues.

Performance Monitoring
Wrap the operations that matter in Performance Traces. See how network requests, platform channels, expensive widget builds and rendering stack up within a single flow or across millions of sessions with waterfall charts that make the slow parts obvious.
Every trace comes with full device and app context and ties back to its session timeline, so a slow span never shows up without the conditions that produced it.

App Health
Keep a close eye on every release with App Health. Follow adoption, crash-free sessions, user perceived error rates, app size, and launch times across your Android and iOS builds.
Notice a buggy rollout early and fix it before it spreads to the rest of your users.

Bug Reports
Let users report a problem the second they notice it with Bug Reports, triggered by a device shake or from your own button through the SDK. Each report packages device details, app version, network conditions and a screenshot next to the user's description, and makes it easy to jump straight to the matching session timeline.
Forget the email threads and support ticket back-and-forth — your users explain the issue in their own words and you get every bit of context needed to resolve it.

User Journeys
Follow the paths people take through your production app with User Journeys. Every screen transition is charted automatically into clear flow diagrams, and the exception view marks exactly where issues derail those flows.
Deciding what to fix first? See which routes carry the most users so you can clear the most frequent blockers.

Network Monitoring
See every request your app makes with Network Performance. Follow how HTTP status codes shift over time and drill into your heaviest endpoints, ranked by latency, error rate and call volume, to find the requests slowing down your app.
Catch failing endpoints early and tune the API calls your users depend on most.


Coding Agents
Bring Measure's full context into the coding agents you already work with. The Measure MCP server hands any agent your crashes, errors, performance traces and session timelines, directly from your IDE, editor or terminal.
Point it at a crash, work through user sessions, or build it into an agentic triage and debugging pipeline. Whether you're on Claude Code or Codex, or you prefer open source agents and models, Measure drops straight into your workflow.