

Devices
Compare sessions, errors, launch time, trace duration and memory usage across the device models that your mobile apps run on.
The Devices page shows how your app performs on each device model. Use it to find devices with the most errors, the slowest launches, or the highest memory usage, then open a device's details to investigate.
A device is identified by its manufacturer and model, such as a Google Pixel 11 Pro running Android or an Apple iPhone 18 Pro running iOS. Each row shows the model, with the manufacturer and device name below it. Events without a device model are excluded.
Sessions over time
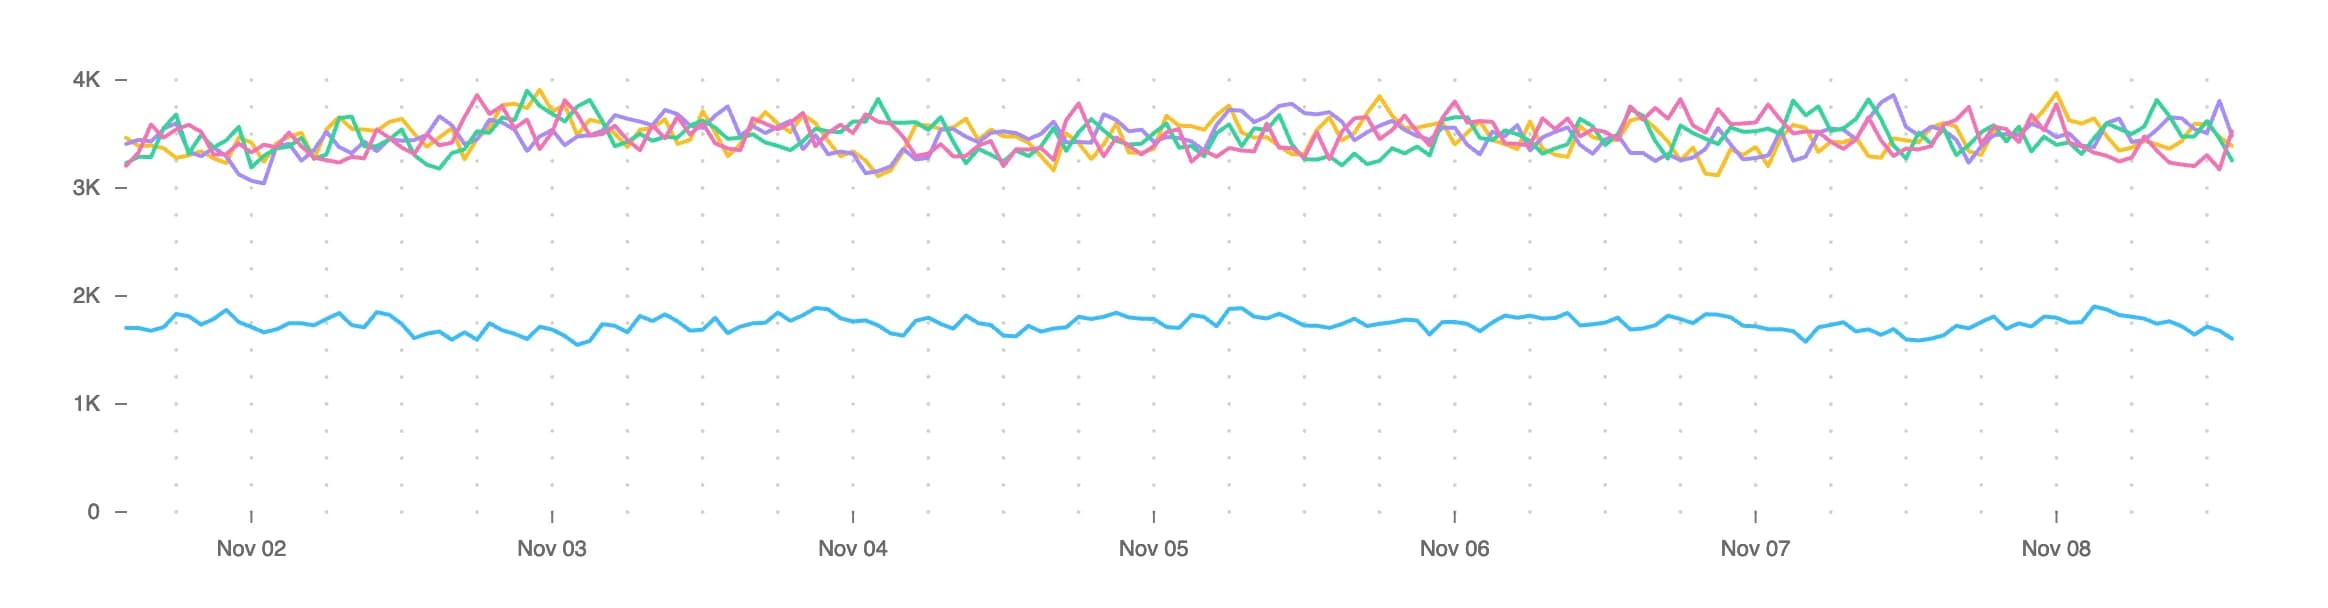
The plot shows session counts over time for the five device models with the most sessions. Each session is counted once, in the period when it started.
Lists
The page has a list for each metric. Lists are ranked from highest to lowest by default. Select Lowest to reverse the ranking. Each list shows five devices at a time, and you can page through the rest.
- Sessions shows the number of sessions on each device and its share of all sessions in the selected date range. Select a row to open session replays for that device.
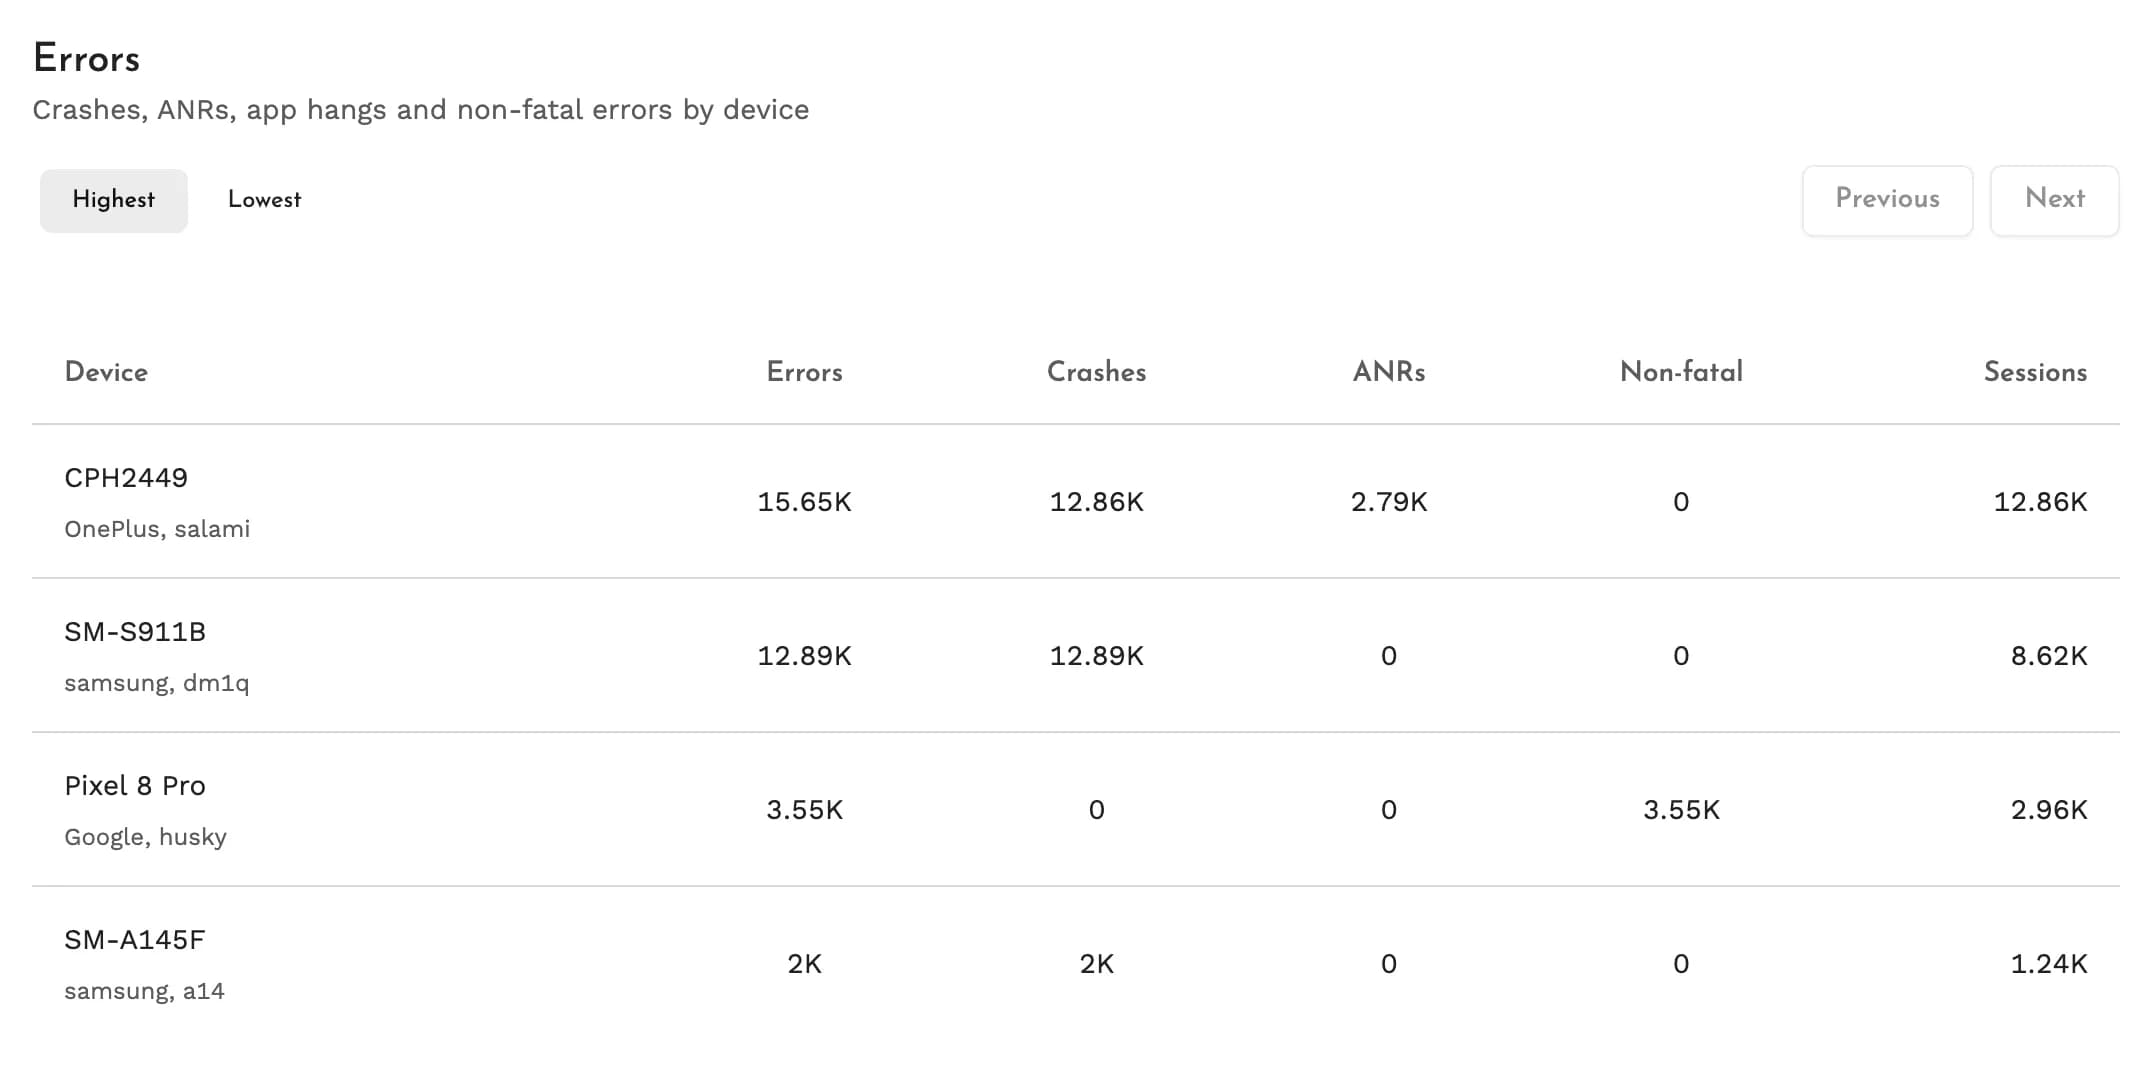
- Errors shows crashes, Android ANRs, iOS app hangs, and non-fatal errors, along with the number of sessions that had an error. Select a row to open errors for that device.
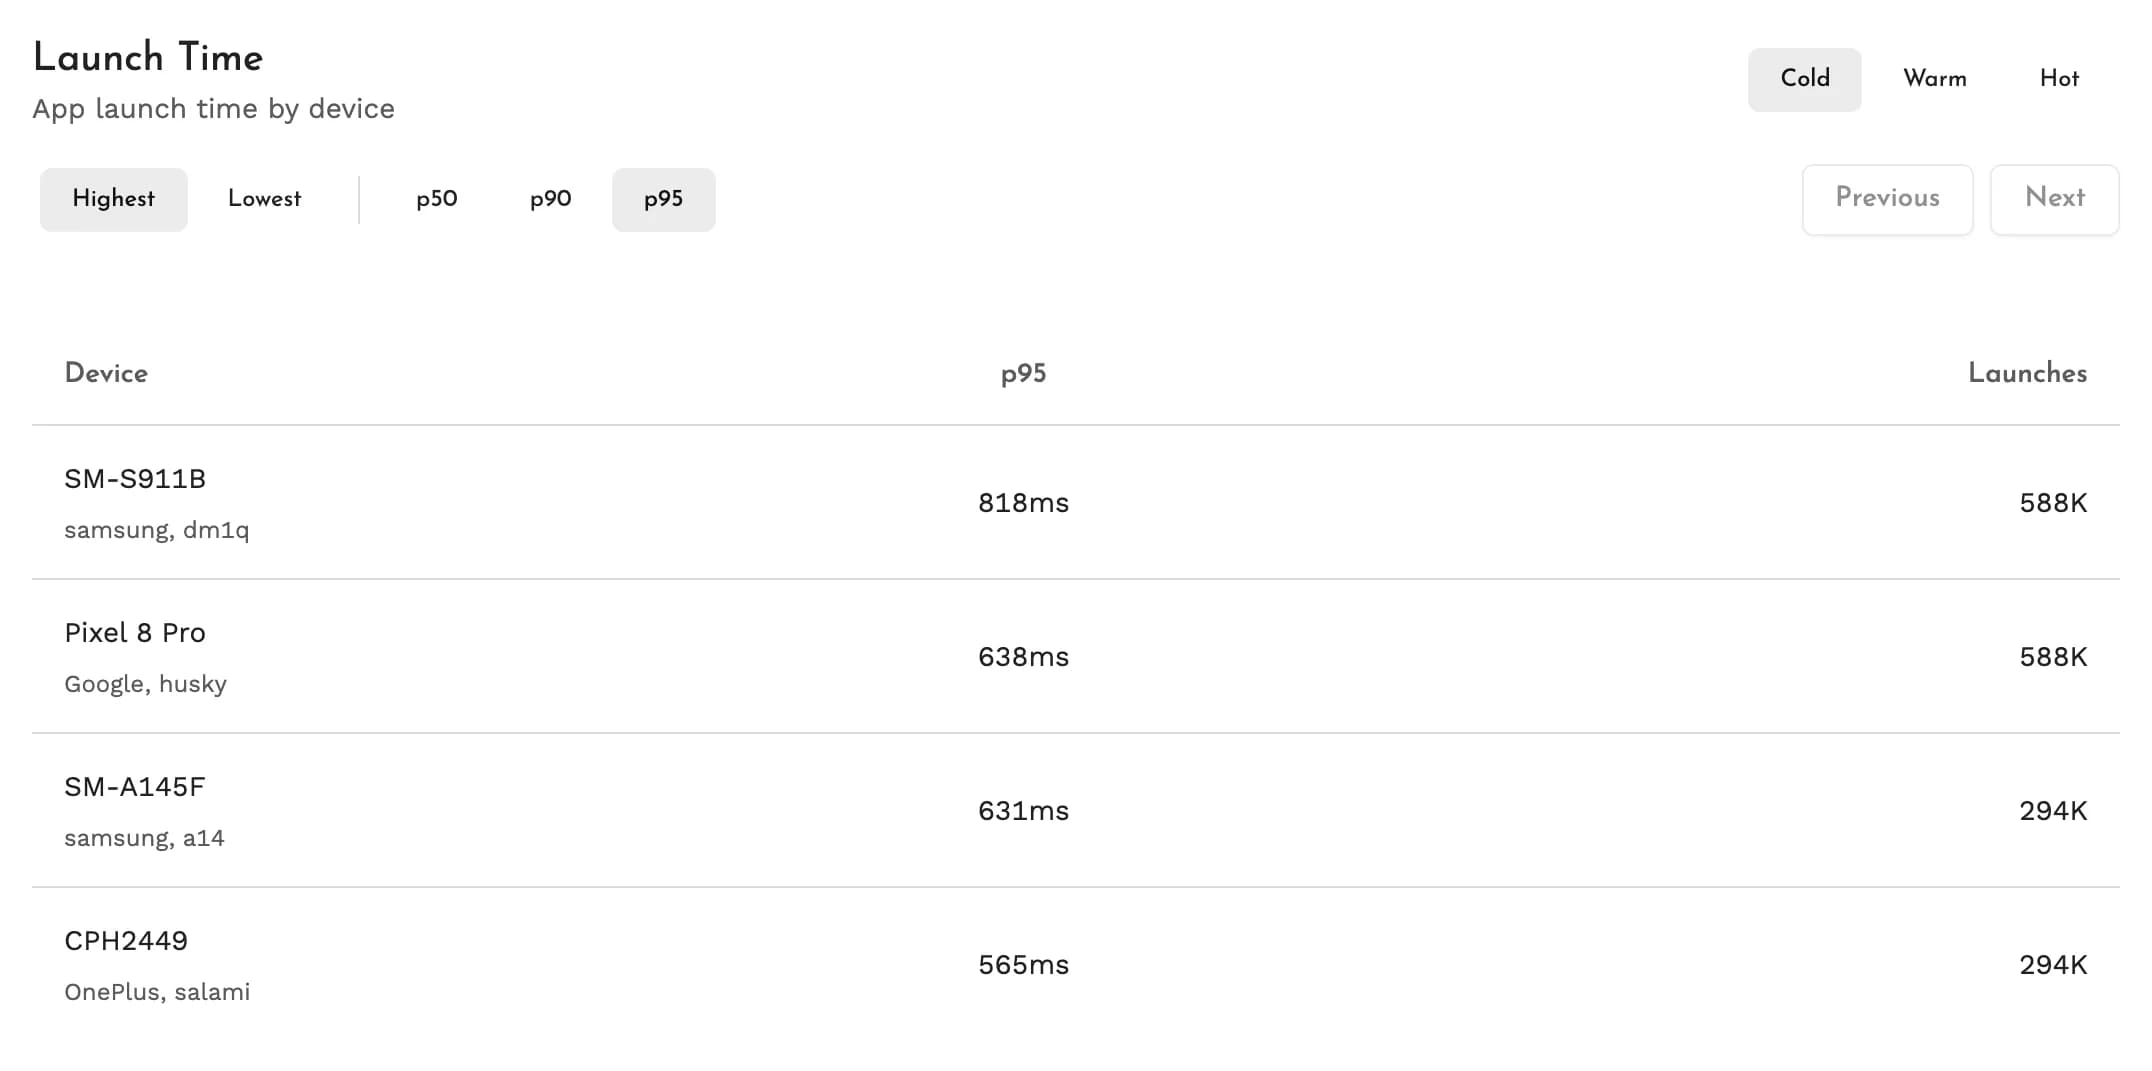
- Launch Time shows launch time for cold, warm, or hot launches, along with the number of launches. On Android, select a row to open profiles for that device. See App launch metrics for how each launch type is measured.
- Traces shows the duration of the selected root span, along with the number of spans. Select a row to open traces for that span on the device.
- Memory shows memory usage from samples taken in every app state, along with the number of sessions. Select a row to open memory usage for that device. See Memory monitoring for how memory is measured.
Launch Time, Traces, and Memory are ranked by a percentile. Choose p50, p90, or p95 next to Highest or Lowest to set the percentile shown in the list.
Filters
Filter devices by app version, OS version, device manufacturer, device model, or device name. The filters and selected date range apply to the plot and every list. When you open another page from a row, it is filtered to that device and keeps the date range.
Devices over MCP
Coding agents connected to Measure's MCP server can read session counts over time by device and rank devices by sessions, errors, launch time, trace duration, and memory usage. See the full tool list.
Think this page can be better?
Open an issue