

Adaptive Capture
Tune what Measure collects from the dashboard. Adjust sampling, masking, and log collection without releasing a new app version.
Adaptive Capture lets you tune what Measure collects straight from the dashboard, without releasing a new app version. Adjust sampling rates, screenshot masking, log collection, and more from the "Apps" tab.
The SDK fetches this configuration and caches it locally, so a change takes two app launches to take effect. The first launch fetches and caches the new settings, and the next one applies them.
Defaults
Every app starts with these defaults:
| Configuration | Default value |
|---|---|
| Take screenshot on crash | true |
| Crash session replay duration | 300 seconds (5 minutes) |
| Take screenshot on ANR | true |
| ANR session replay duration | 300 seconds (5 minutes) |
| Bug report session replay duration | 300 |
| Trace sampling rate | 100% |
| Journey sampling rate | 100% |
| Launch metrics sampling rate | 100% |
| Disable HTTP event for URLs | (empty) |
| Track HTTP request body for URLs | (empty) |
| Track HTTP response body for URLs | (empty) |
| Blocked HTTP headers | Authorization, Cookie, Set-Cookie, Proxy-Authorization, WWW-Authenticate, X-Api-Key |
| Screenshot mask level | AllTextAndMedia |
| Automatic log collection | false |
| Minimum log severity | Warning |
| Log ignore patterns | (empty) |
Errors
These settings apply to crashes and ANRs, the fatal errors.
Screenshots
Each crash and ANR report includes a screenshot of the screen at the moment it happened. Turn this off if screenshots aren't something you want to capture.
Session replay duration
Every crash and ANR arrives with a replay of the events in the minutes before it. Adjust how far back that window reaches to trade off detail against data volume. By default it captures the 5 minutes before the error.
Bug reports
Session replay duration
Each bug report carries a replay of what the user did before submitting it. Set how far back it reaches to capture more or less of the session. By default it goes back 5 minutes.
Trace sampling
Measure reports every trace by default. Set the sampling rate anywhere from 100% down to 0.001% to control how much trace data you collect.
Launch metrics sampling
Launch metrics cover cold, warm, and hot launches, shown on the Overview page in the dashboard. Set a sampling rate to control how many sessions collect them. Every session collects launch metrics by default, and you can lower the rate to 0.001%.
Journey sampling
Journey events power the Journey view in the dashboard. They cover screen view events on all platforms, activity and fragment lifecycle events on Android, and view controller lifecycle events on iOS. Set a sampling rate to control how many sessions collect them. Every session collects journey events by default, and you can lower the rate to 0.001%.
HTTP events
HTTP events record the network requests your app makes. Tune what gets collected with the options below.
Sampling
Required minimum SDK versions: Android 0.16.1 and iOS 0.9.2
Set a sampling rate to control how often HTTP events are collected. All of them are collected by default, and you can lower the rate to 0.001%.
Collect or ignore specific URLs
Turn HTTP event collection on or off for specific URLs. Match a URL exactly, or use * as a
wildcard.
Examples:
- Disable a specific endpoint:
https://example.com/api/v1/users - Disable a domain and all its endpoints:
https://example.com/* - Disable a specific path across all domains:
*/api/v1/orders - Disable a specific URL path:
https://example.com/api/*/payments
Request body collection
Request bodies and headers aren't collected by default. List the URLs you want them collected
for, matching exactly or with * wildcards. Enable this only for URLs you trust to be free of
sensitive data and small in payload size.
Response body collection
Response bodies and headers aren't collected by default either. List the URLs you want them
collected for, using exact matches or * wildcards. As with request bodies, reserve this for
URLs without sensitive data and with small payloads.
Blocked headers
Headers are only collected for URLs where you've enabled request or response body collection. Even then, you can block specific headers by name. Matching is case-insensitive.
These headers are never collected, whether or not you list them:
- Authorization
- Cookie
- Set-Cookie
- Proxy-Authorization
- WWW-Authenticate
- X-Api-Key
Screenshot mask level
Mask screenshots collected with crashes and ANRs to keep sensitive information from leaking. Pick how much to hide.
The mask level configuration does not apply to SwiftUI screens.
Because of the way SwiftUI renders its views, all SwiftUI content is masked by default regardless of
the mask level setting. Control masking for individual SwiftUI views with the .msrMask() and
.msrUnmask() modifiers.
Choose from these levels:
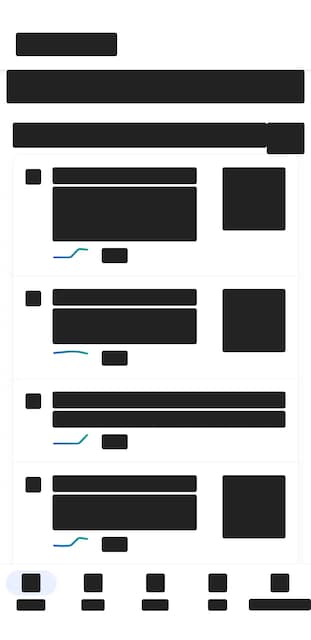
Mask all text and media
Hides all text, buttons, input fields, images, and video.
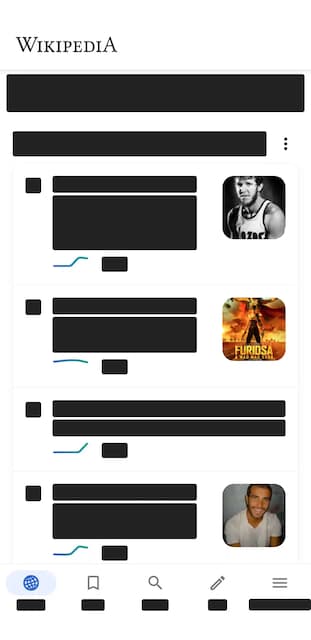
Mask all text
Hides all text, buttons, and input fields.
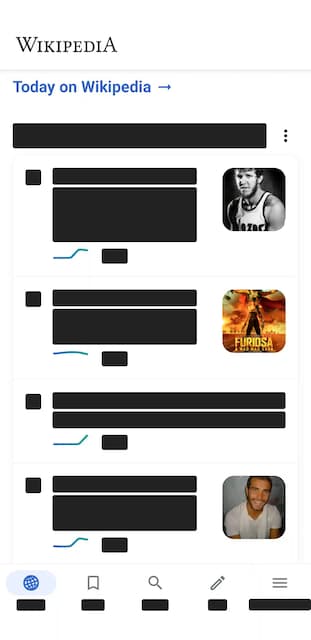
Mask text except clickable
Hides all text and input fields, but leaves clickable views like buttons visible.
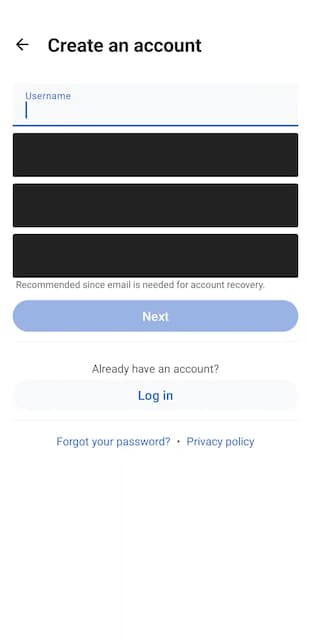
Mask sensitive input fields
Hides sensitive input fields like password, email, and phone fields.
Logs
The Logs settings control how the SDK collects logs.
Automatic log collection
Applies only to Android and React Native.
Collect logs written to the platform's standard log streams automatically. Logs you track
manually with the log API are always collected, whatever this is set to. Off by default.
Minimum log level
Set the lowest severity worth collecting. Anything below it is dropped at the source, for both
automatic logs and logs tracked with the Measure.log API. The levels, from lowest to highest,
are debug, info, warning, error, and fatal. By default Measure keeps warning and
above, dropping debug and info.
Ignore patterns
List regular expressions to match against the log body. Any log whose body matches a pattern is discarded at the source.
Think this page can be better?
Open an issue