

Journeys
See the paths users take through your mobile app, where they drop off, and the issues they run into along the way.
A journey is a graph of the screens and custom events users go through in your app. For example, a user might open the home screen, view a product, then add it to their cart.
Journeys show how many users reach each screen or event, where they go next, how long they take between steps, and what issues they encounter.
Journeys complement funnels. Funnels track a predefined sequence of steps. Journeys let you explore the paths users actually take, making it easier to discover patterns and issues that funnels might miss.
Steps
Each step in a session represents a screen, a custom event, or a fatal error.
- Screens come from navigation tracking, which describes the screens collected on each platform and how to track others.
- Custom events are events your app sends using
trackEvent, as described in Custom events. - Fatal errors mark the end of a session in which a crash, ANR, or app hang kills the app. Steps after a fatal error are excluded from that session.
Repeated occurrences of the same screen or event in a row count as a single step. For example, an Android activity being created and then resumed counts as one step.
Journeys are calculated from collected events, so newly added screens and custom events also appear in historical data. Journeys are visible to everyone on your team.
How users are counted
Users are counted by app installation. Within the selected date range, each user counts once for every screen or event they reach, regardless of how many times they reach it.
A link between two steps counts users who moved directly from one to the other at least once in the same session. Transitions across sessions don't count. For example, closing the app on one screen and reopening it later on another doesn't create a link between those screens.
Sampling
For large datasets, Journeys analyzes a sample of users to estimate results for all users and keep the graph responsive. When the selected date range contains few events, all users are included.
User counts, drop-offs, and timings are calculated from the sample.
Sampled at, shown below the graph, indicates the percentage of users included in the analysis. The same sample is used for the graph and the lists of errors, traces, network requests, and session replays for the selected screen, event, or path.
Filters don't change the sample size. If a filter matches only a small number of users, those users might not appear in the sample. When no users in the sample match, Sampled at shows –. This doesn't mean no matching users exist; they might simply be missing from the sample.
To analyze a larger sample, select a shorter date range.
Graph
The graph represents screens and custom events as nodes. All sessions that end in a fatal error share a single fatal-error node. Links between nodes show how many users moved directly from one step to the next.
Hover over a node to see:
- How many users reached it.
- How many continued to another step.
- How many dropped off.
- The median time since the previous step.
Hover over a link to see how many users followed it and what percentage of users at the source node took that path.
By default, the graph shows a selection of screens and events with the most users. Use Select Nodes to choose which ones to display. Drag the graph to pan, or hold Ctrl while scrolling to zoom.
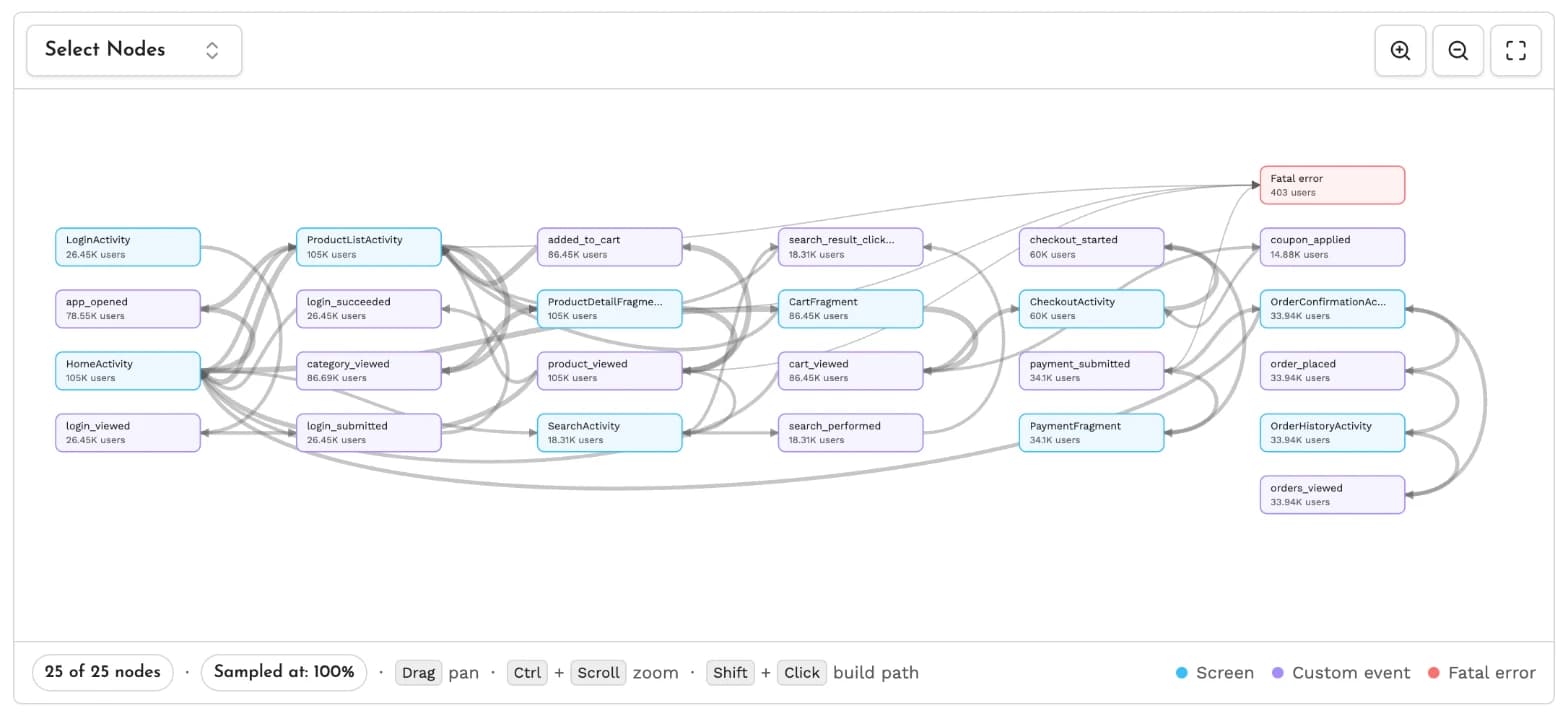
Nodes, links, and paths
Select a node or link, or build a path, to inspect the errors, traces, network requests, and session replays associated with it.
- Node: All sessions that visited a screen or triggered an event, up to the next step.
- Link: Sessions that moved directly from one step to another.
- Path: Sessions that followed a specific sequence of steps, from start to finish.
Nodes include both successful and failed sessions. Paths narrow the view to sessions that followed the selected sequence, making it easier to investigate what happened along the way.
For example, a path from Checkout to a fatal error shows the activity leading up to the crash. A path from Product to Home shows what happened in sessions where users left a product page without adding anything to their cart.
To build a path, select the first step, then Shift-click the next step or click the + button. Available next steps are highlighted. Shift-click the last step to remove it.
Each path shows the number of users who followed it and the percentage of users who reached the first step and continued along that path.
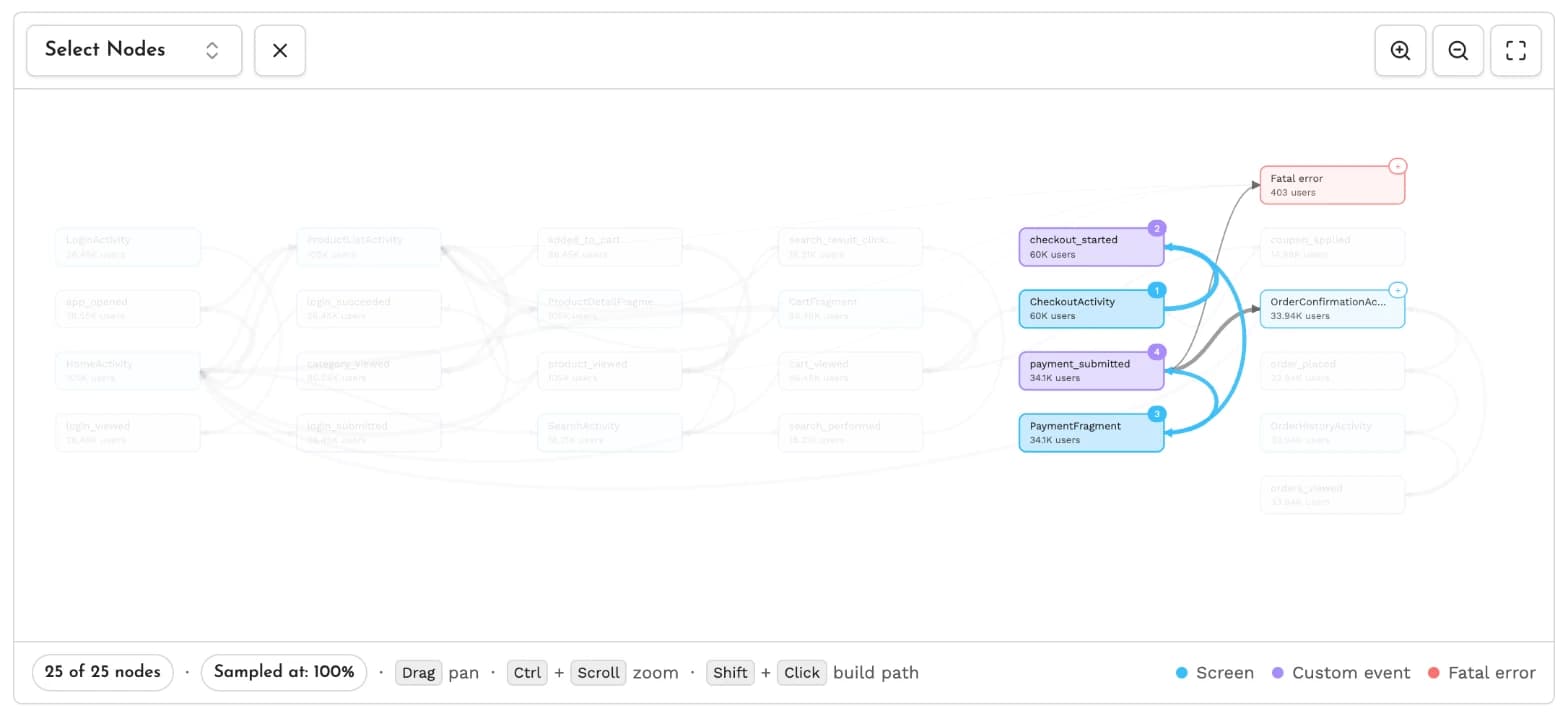
Errors, traces, and network requests
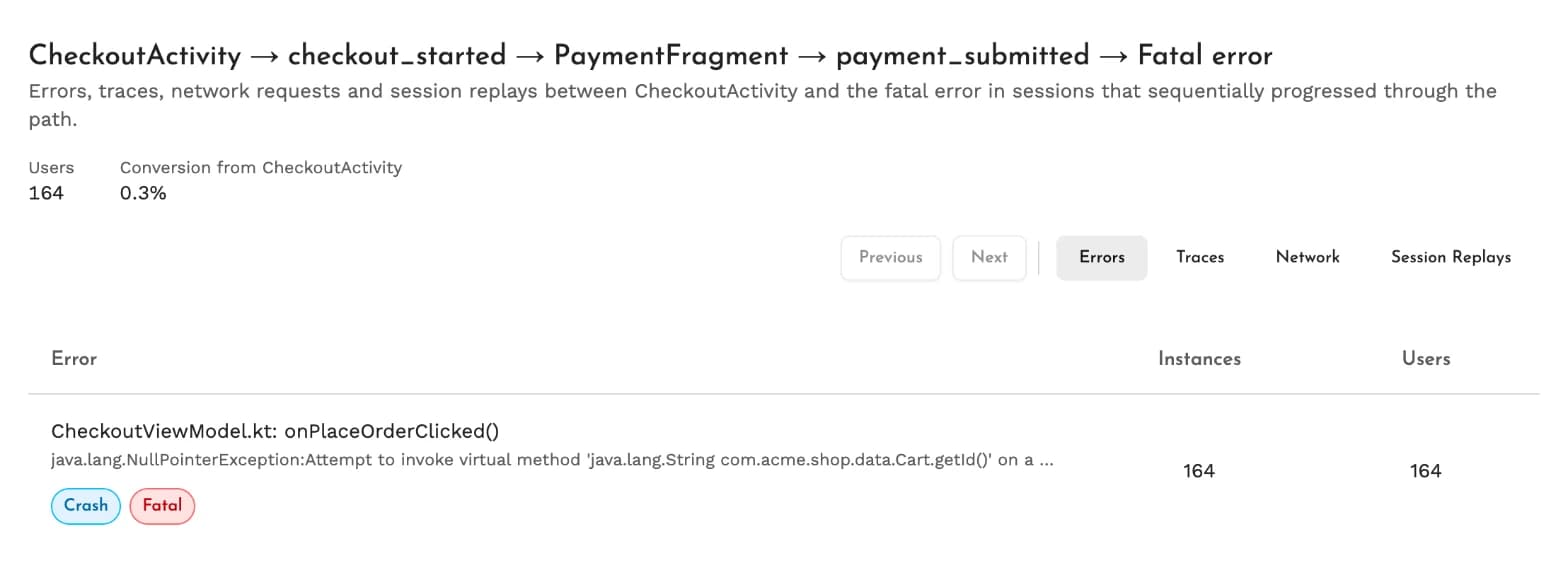
The details for a selection show the issues users encountered along the selected node, link, or path.
- Errors lists crashes, ANRs, app hangs, and other errors, along with how many times each occurred and how many users encountered it.
- Traces lists root spans that started within the selection, along with how many times each ran, how many users ran it, and its duration. Choose a percentile to view using p50, p90, p95, or p99.
- Network lists requests grouped by URL pattern, along with the number of requests, the number of users who made them, and their latency. Requests lasting longer than one minute are excluded because they're usually persistent connections.
Rows are sorted by user count, highest first. Select a row to open its details page.
Session replays
Session replays lists the sessions in the sample that followed the selected node, link, or path. Sessions are sorted by most recent first.
Select a session to open its replay.
Filters
Filter journeys by app, OS, device, network, location, or any custom attributes set in your app.
A custom attribute filter matches a session if the attribute was set at any point during that session, regardless of which event set it.
The selected date range applies to both the graph and the details for the selected node, link, or path.
Journeys over MCP
Coding agents connected to Measure's MCP server can read journeys, inspect the users who followed a path, and retrieve errors, traces, network requests, and sessions associated with a node, or a path.
See the full tool list.
Configuration options
Journeys are built from screen views and custom events sent by sampled app installations. Set the share of installations that are sampled with the analytics sampling rate in app settings. Other installations only send these events as part of a crash or bug report.
Think this page can be better?
Open an issue