

Endpoint patterns
See how Measure groups similar request URLs into endpoint patterns, when a new endpoint shows up, and how to search for one on the dashboard.
Measure groups many similar request URLs into one endpoint pattern. Requests to /api/users/123/profile and /api/users/456/profile roll up into /api/users/*/profile. You can view combined latency, error rate, and volume for that endpoint. This happens automatically.
How a URL becomes a pattern
Measure wildcards the parts of a path that change from request to request. A segment gets replaced with * in one of two ways.
Known dynamic formats
Measure matches each segment against the formats that dynamic values usually take, and replaces a match with *. A segment is replaced when it's:
- A UUID (e.g.
550e8400-e29b-41d4-a716-446655440000). - A SHA-1 or MD5 hash.
- An ISO 8601 date-time, the
2024-01-15T...form. - A
0x-prefixed hex value (e.g.0x1a2b3c). - Any segment with two or more digits in a row. Single-digit segments like
v1are kept.
So /api/users/550e8400-e29b-41d4-a716-446655440000/orders/12345 becomes /api/users/*/orders/*.
High-cardinality segments
Some changing segments don't match any known format, like a product slug or a username. Measure tracks how many distinct values appear at each position in a path. Once a position collects many distinct values (more than 10), Measure collapses it to * too. So /api/products/aluminium, /api/products/copper, and dozens more roll up into /api/products/*.
A pattern appears once its endpoint gets more than 50 requests in an hour.
A brand-new or low-traffic endpoint won't show up in Network Monitoring right away.
Searching for endpoints
Search for an endpoint or explore a group of related endpoints. Type a domain, path, or keyword, then select a matching result to view its charts.
| Search | Example |
|---|---|
| Free text search | Enter any text like users |
| Domain | api.example.com |
| Everything below a path | api.example.com/v1/ |
| A specific endpoint | api.example.com/v1/products/123 |
| Routes one level below a path | api.example.com/v1/* |
| All routes below a path, nested included | api.example.com/v1/** |
Search is not case-sensitive. You can also use wildcards to explore a group of endpoints:
- Use
*for one part of a URL path. For example,/v1/*matches/v1/cart, but not/v1/products/123. - Use
**at the end of a path to include all nested routes. For example,/v1/**includes both/v1/cartand/v1/products/123.
Top endpoints
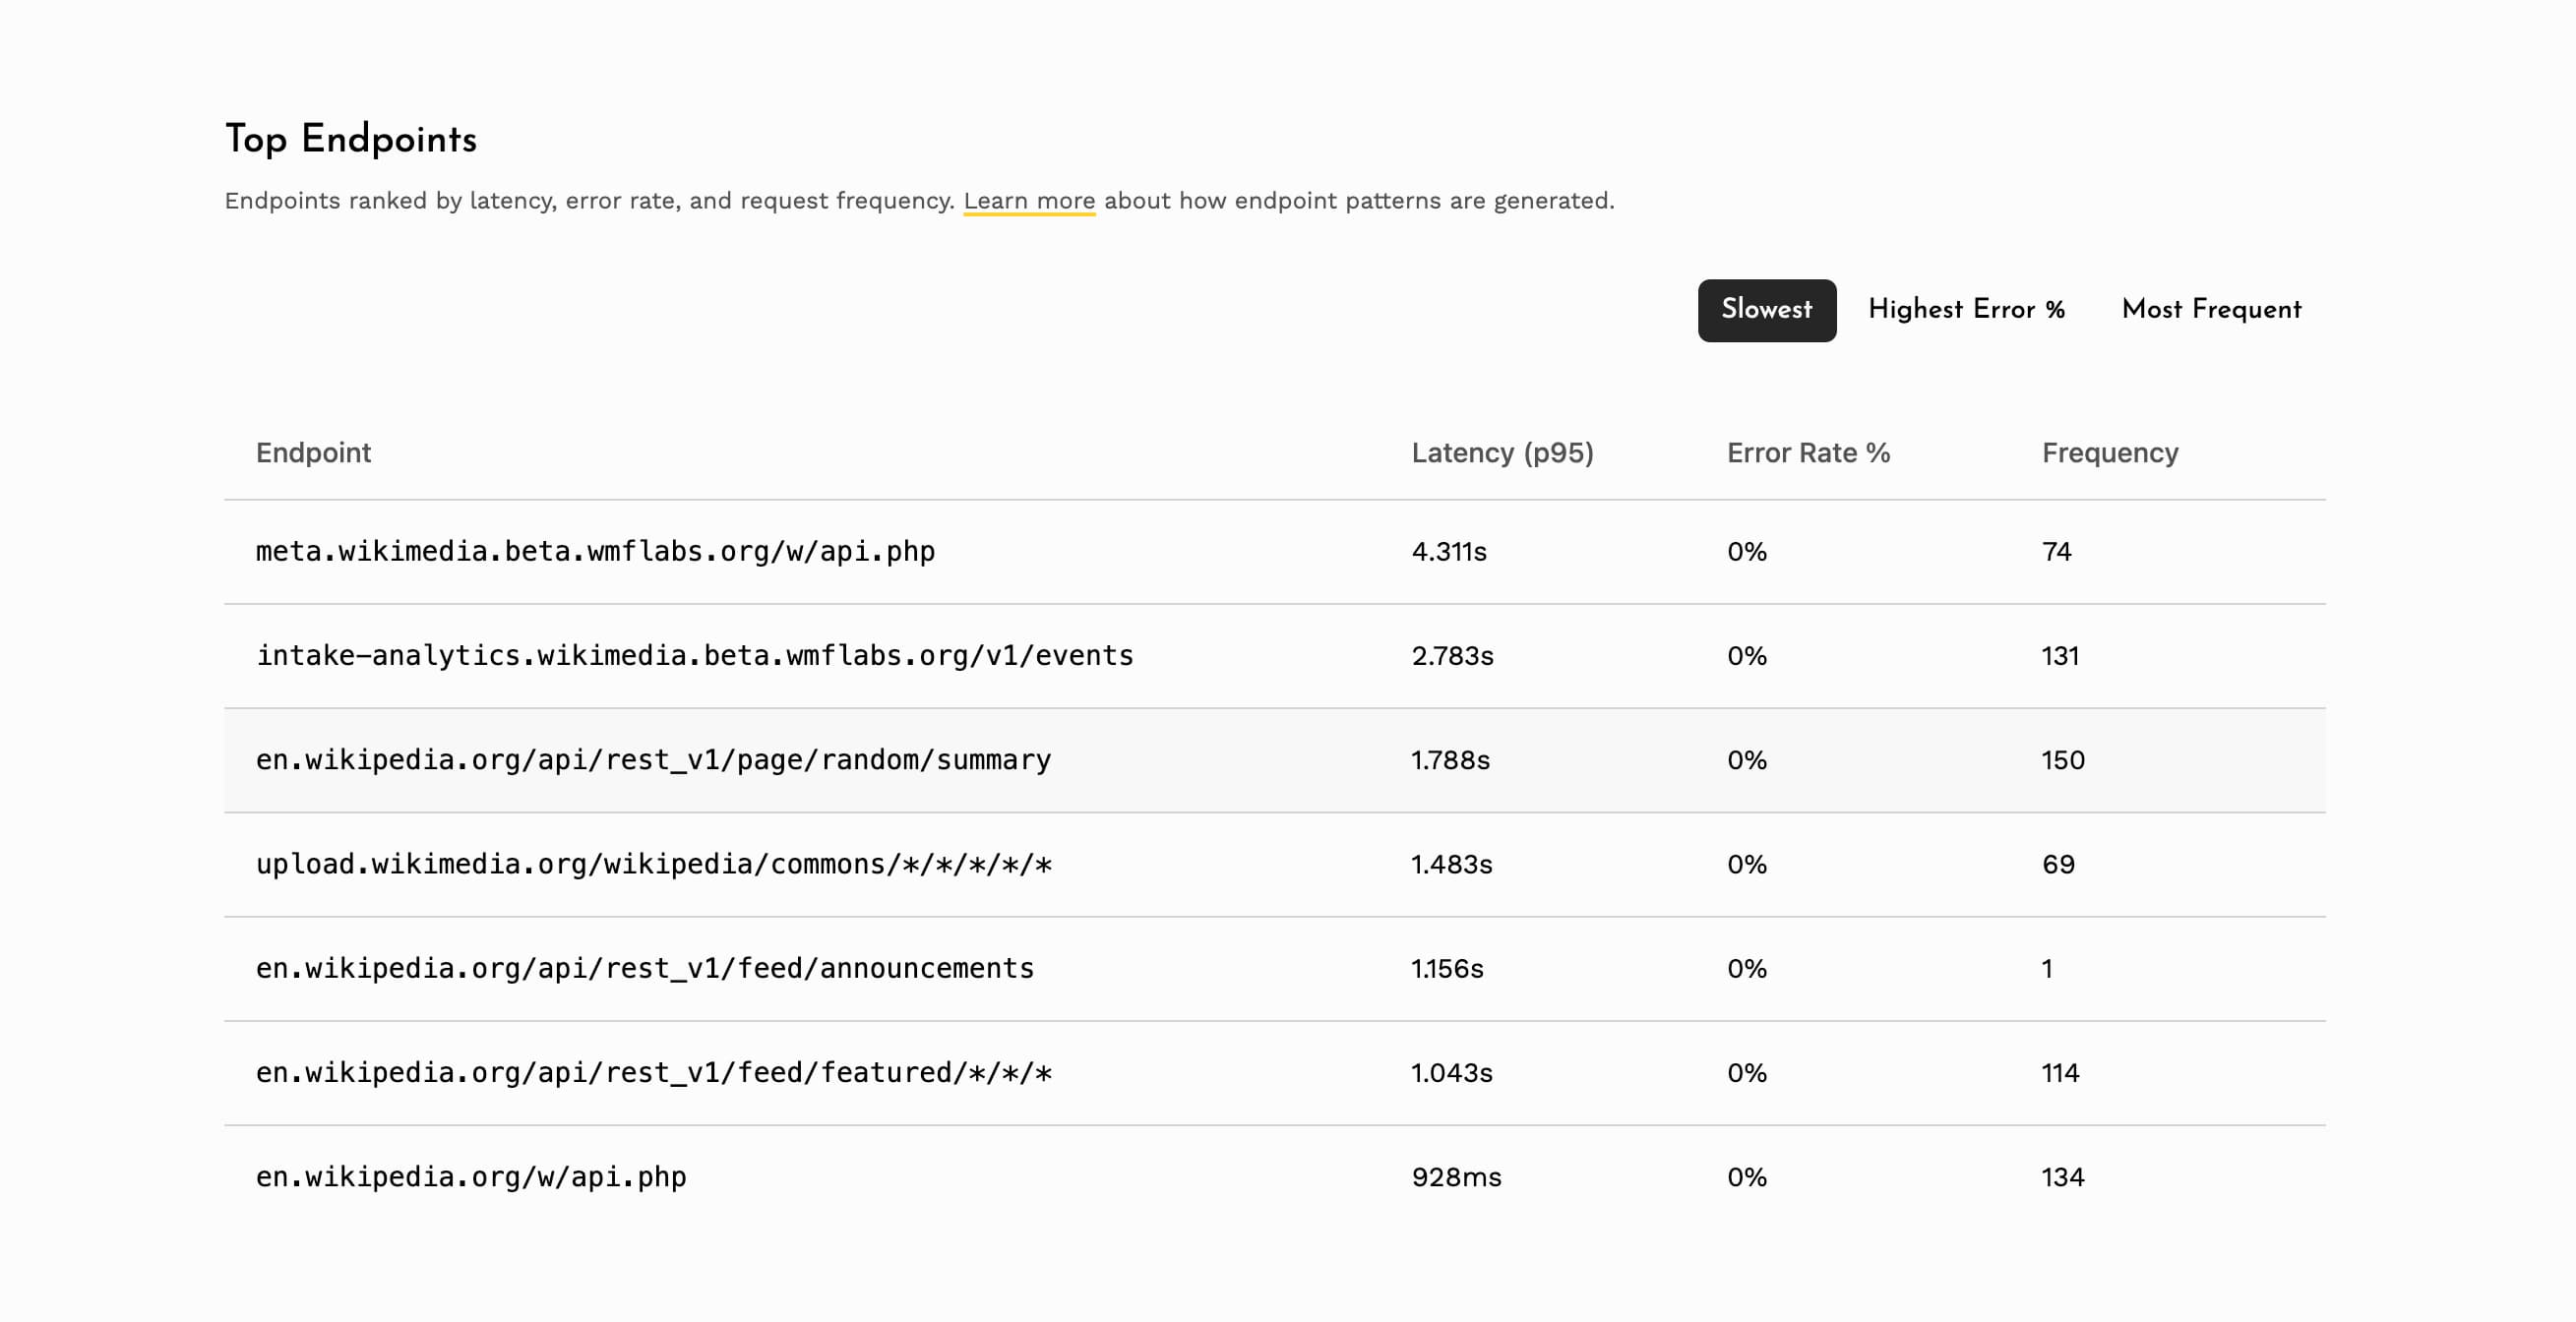
The top endpoints section provides a ranked summary of your app's API endpoints across three dimensions.
| Ranking | Ordered by |
|---|---|
| Slowest | p95 latency, helping identify the slowest APIs affecting user experience. |
| Highest error % | Percentage of 4xx and 5xx responses, highlighting unreliable APIs. |
| Most frequent | Total request count, showing which APIs are called most often. |
Selecting an endpoint opens a detail view with latency percentiles (p50, p90, p95, p99) and status codes over time.
Request timeline
The request timeline is a heatmap of when requests happen relative to session start. It shows the top endpoint patterns ranked by request frequency, and helps answer questions like "which APIs fire on app launch?" and "is anything called repeatedly in the background?"
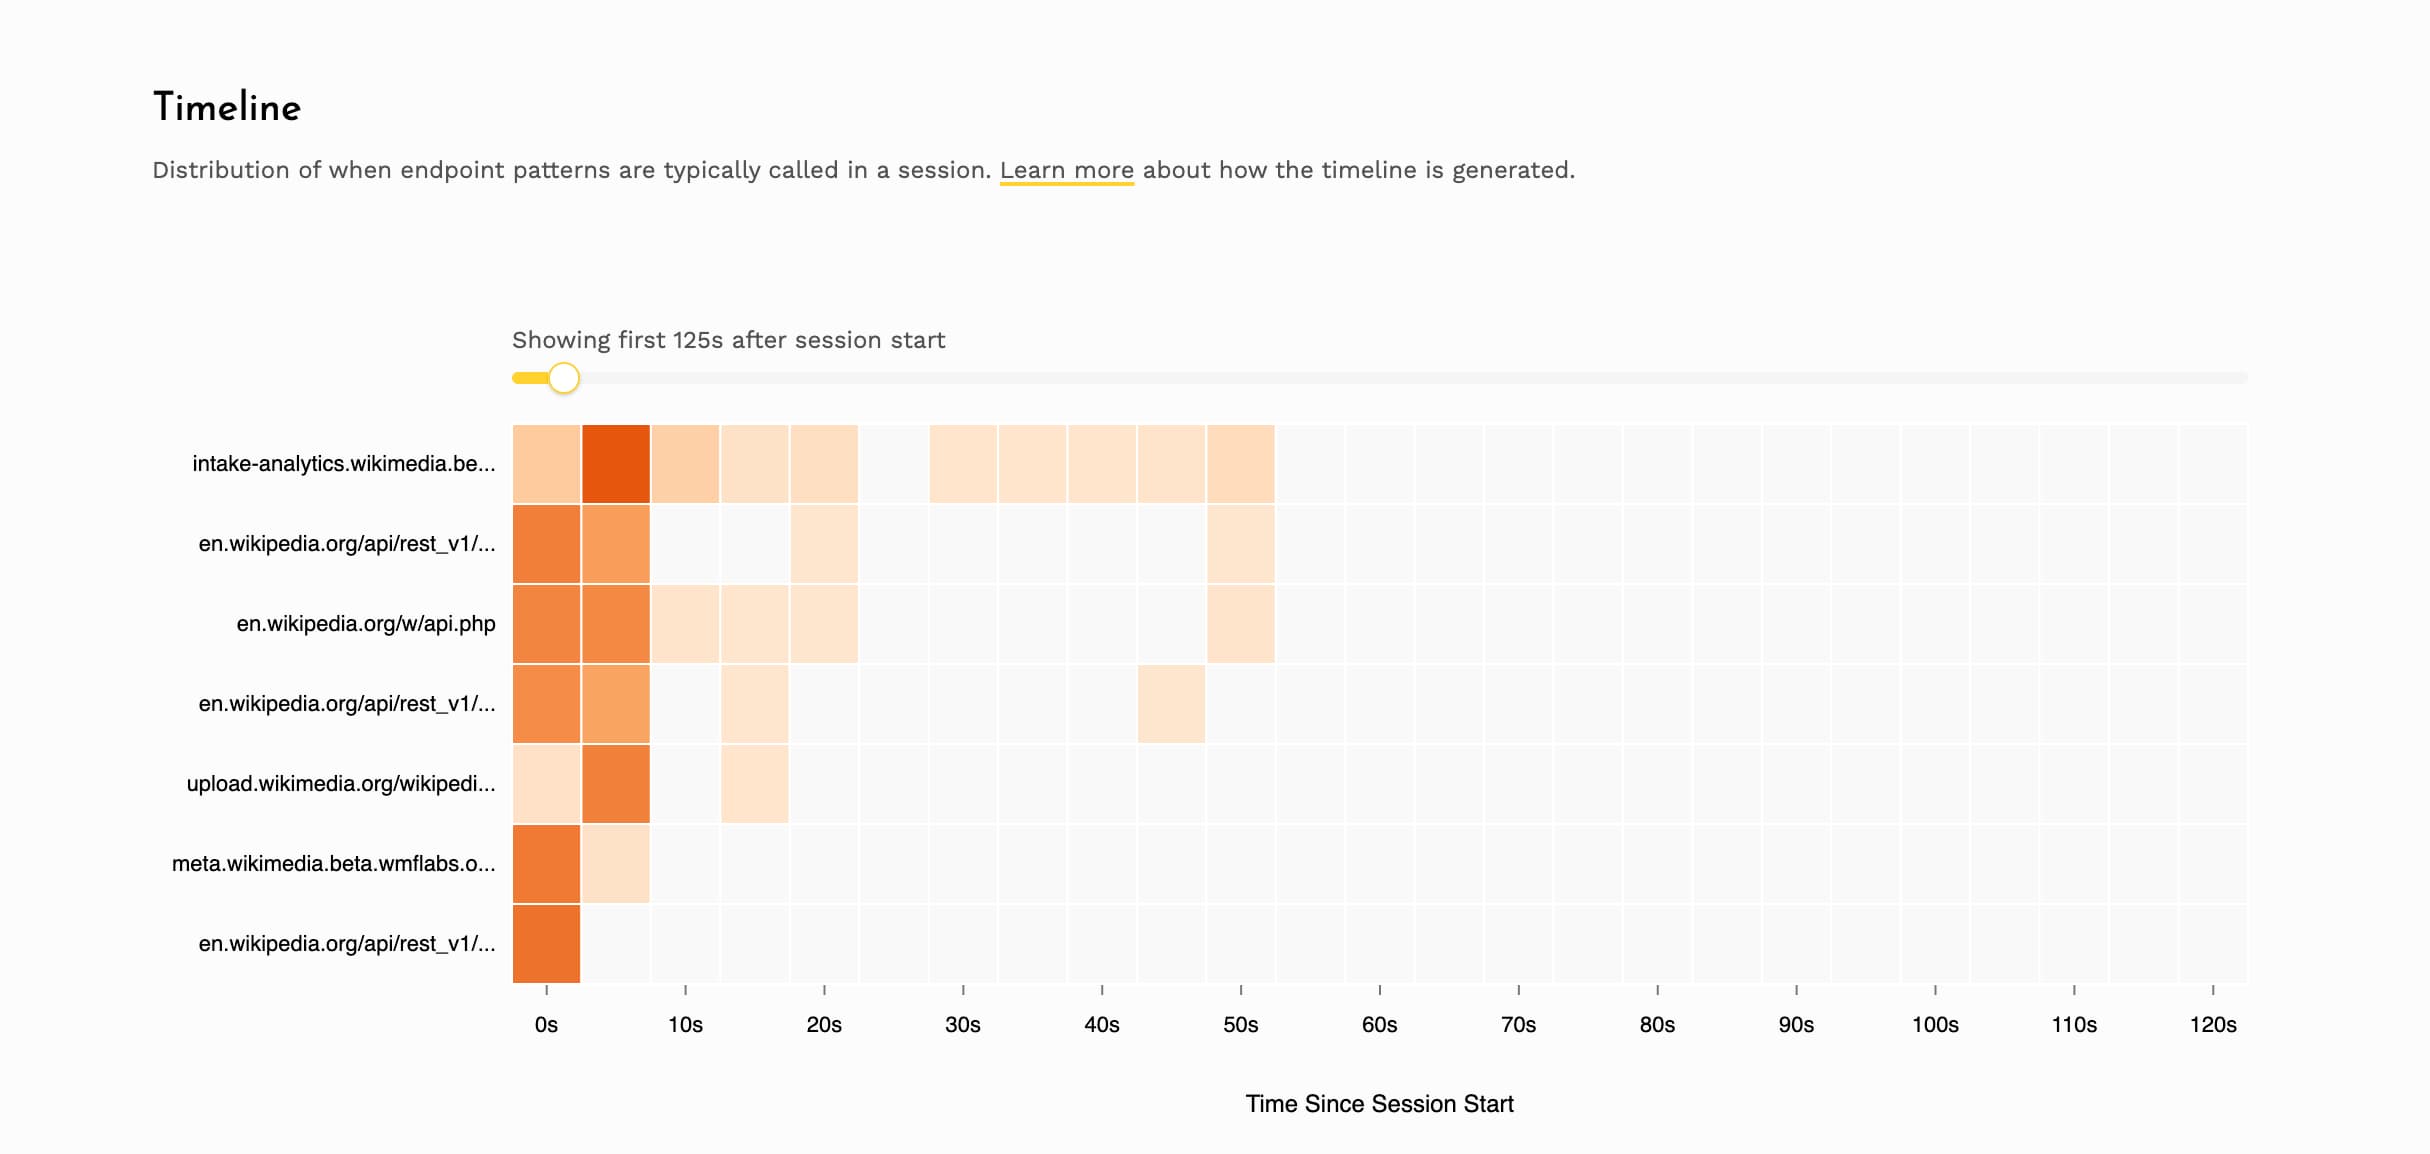
Requires SDK version 0.16.2 on Android and 0.9.2 on iOS.
Think this page can be better?
Open an issueNetwork Monitoring
Monitor HTTP requests, responses, and failures across Android, iOS, Flutter, React Native, and Kotlin Multiplatform, with status codes, latency, and per-endpoint metrics.
Connectivity changes
Track when your app gains or loses connectivity, switches between WiFi and cellular, or changes carrier.