


Off the Main Thread: October 2026
October updates: funnels, iOS app hang reports, clearer ANR grouping, Android native crashes and production Perfetto traces.

Abhay Sood
Grab a coffee. Here's what we've been building, writing and loving in October.
See where users drop off in your app 🪜
Say conversion dropped after your last release. Was it a bug? Finding out usually means digging through crash reports, traces and network logs for the users who dropped off.
Funnels show those crashes, traces and slow network requests next to the step where users dropped off. You can also watch their session replays.
Read Mobile App Funnels for a walkthrough.
Catch crashes in native code 💥
The Android SDK now reports native crashes on Android 12 and above. It captures crashes in your C or C++ code and in SDKs with native libraries. Every native crash comes with a session replay, just like your Java and Kotlin crashes.
Native crash reporting is off by default. Turn it on in the measure block of your app's build.gradle.kts:
measure {
  enableNativeCrashReporting = true
}
See the native crash docs to set it up. To learn why native memory bugs crash with SIGSEGV and how to debug them, read our post on SIGSEGV crashes on Android.
Catch app hangs on iOS 🧊
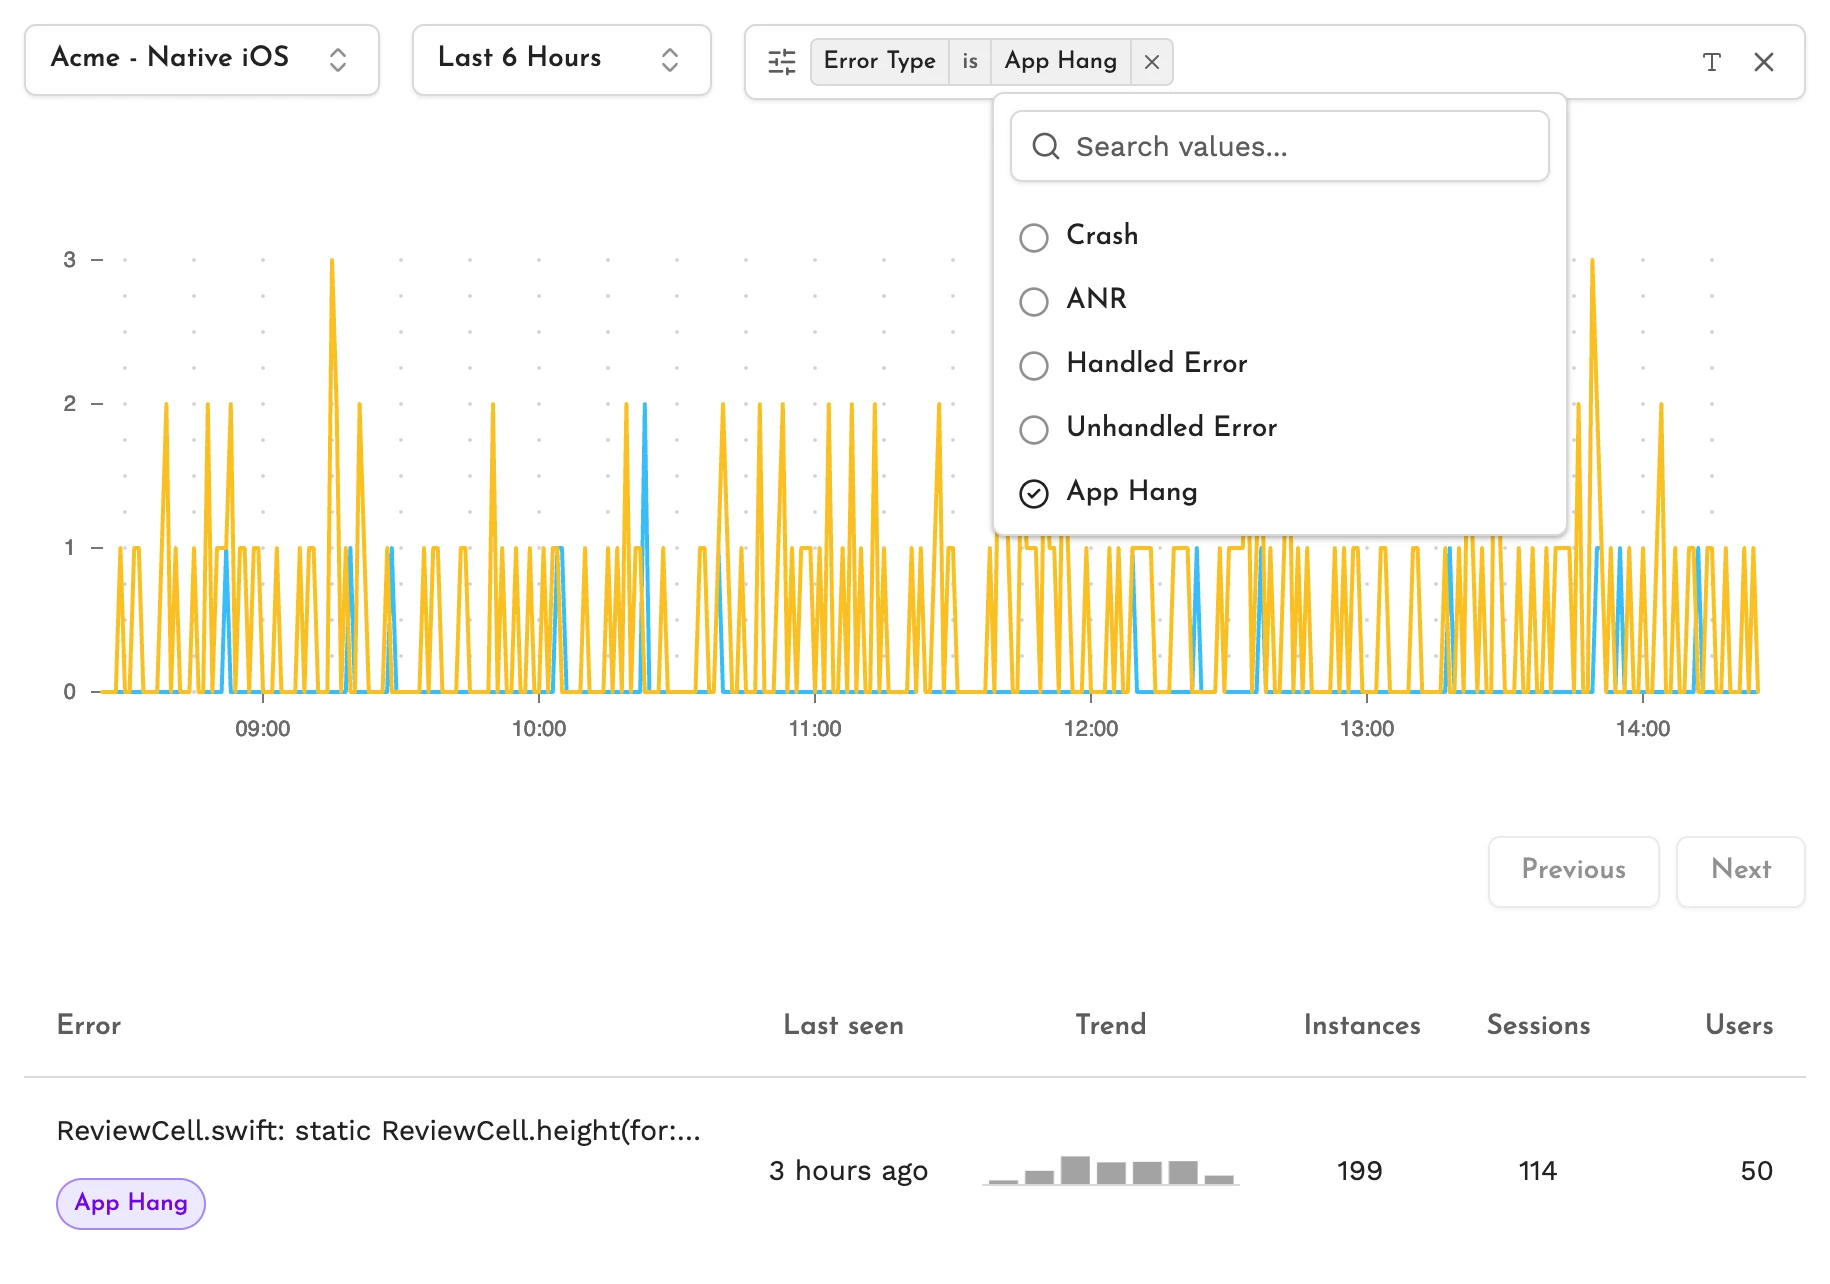
The iOS SDK reports a hang when the main thread stays blocked for at least 2 seconds. Each report includes the main thread's stack, the blocked duration and whether the app recovered or iOS killed it.
The Errors page groups hangs by where the main thread was blocked. Hang events also appear in session replay, in the app hang free sessions count on the overview page and in the daily email. Change the threshold and sampling from the dashboard without shipping a new build.
See App hang reporting for how detection works.
Better grouping for ANRs 🔍
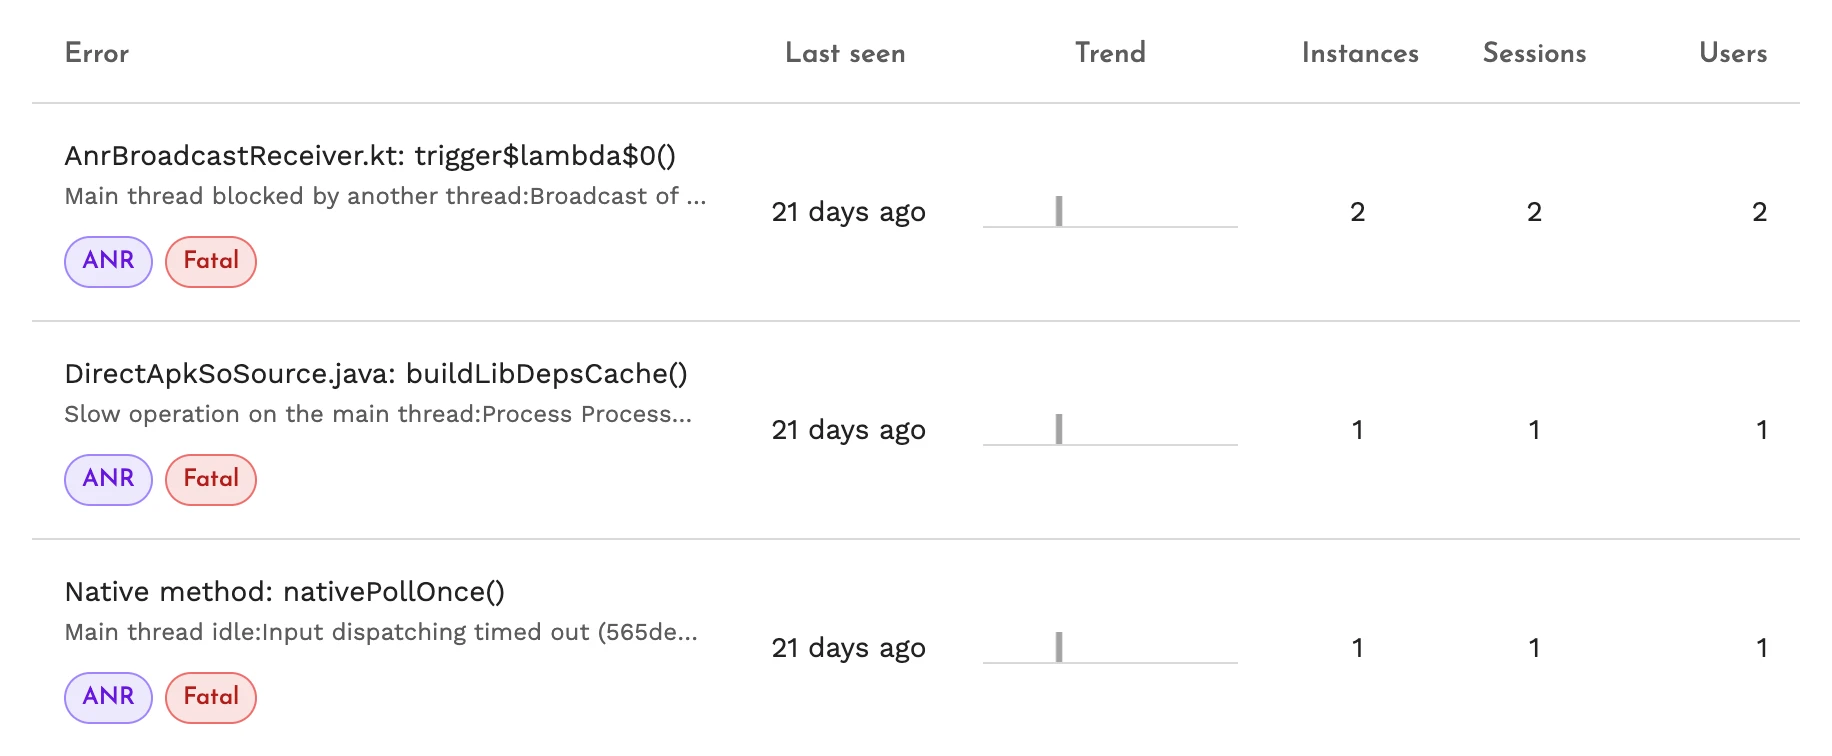
On Android 11 and above, the SDK now collects the full ART thread dump for each ANR. We use it to group ANRs by the code that blocked the main thread, including when the main thread is waiting on a lock held by another thread.
Read our post on diagnosing ANRs in production for more on reading thread dumps.
Perfetto traces from production 📈
The Profiles page lists Perfetto traces and heap dumps captured on users' devices. Filter by trigger, then open a trace in Perfetto from the page.
The Android SDK also supports Android 17 triggers. Android can capture a heap dump when your app runs out of memory, a trace of a slow cold start or a trace when it kills your app for using too much CPU.
Read Debug Android Performance in Production With Trigger-Based Profiling to see how we use these traces.
Ask your coding agent about your app 🤖
Connect our MCP server to Claude Code, Codex or Cursor and ask questions about your app in plain words. It can look into crashes, ANRs, sessions, traces, network requests and funnels. In the video below, Claude Code looks into a drop in orders. It creates a funnel, finds the release where conversion dropped and traces the drop to a crash in that release.
From the blog ✍️
- Mobile app funnels: track your app's core flows across releases and fix the issues that make users drop off.
- Trigger-based profiling: get Perfetto traces and heap dumps from users' devices when your app hits an ANR or runs out of memory.
- SIGSEGV and GWP-ASan: why use after free and buffer overflow bugs crash with SIGSEGV and how GWP-ASan catches them in production.
Caught our eye 👀
These caught our attention:
- Hawkeye at super.money by Sahil Jena: how the super.money team runs every build on real phones with Perfetto to catch slow cold starts before release.
- Netflix's observability knowledge graph by Prasanna Vijayanathan and Renzo Sanchez-Silva: how Netflix links its observability data in a knowledge graph to trace a slow home screen back to its cause.
- A roast in Sunnyvale by Austin Nasso: nothing to do with mobile apps, just a good laugh.
Tell us what you think
If something doesn't work as you expect or you'd like us to build something, talk to us on Discord or open an issue on GitHub.