



Application Not Responding on Android: What Causes ANRs and How to Diagnose Them in Production
What Android measures when it declares an app unresponsive, why ANR stack traces mislead, and how to work backwards from a production ANR report to the code responsible.

Application Not Responding (ANR) errors can be some of the hardest issues to diagnose on Android. All we have is a stack trace collected after the app froze. The stack trace can often be misleading: by the time it was collected, the app may already have recovered. That's why so many Android ANRs show the main thread idle in nativePollOnce.
In this article, we'll look at how Android declares an app unresponsive and the common ANR timeouts. We'll cover how to classify the ANRs your app gets in production with ApplicationExitInfo, and how to read ANR traces. We'll also see why the stack trace often points at the wrong code, how to decide which ANRs to fix first, and how to fix ANRs in Android once you know the cause.
What is an ANR?
An ANR (Application Not Responding) is the error Android raises when an app misses a system timeout: the main thread does not handle an input event within 5 seconds, or a broadcast receiver, service or job does not finish its callback in time. In the foreground, Android also shows the ANR dialog.
An Application Not Responding error occurs when Android waits for your app to do something and it doesn't respond within the allowed time. Android might be waiting for an input event to be handled, a broadcast receiver to finish, or a service callback to return.
An ANR isn't an exception in your code. There's no throwable or crash site. Android records what the process's threads were doing when it collected the ANR trace. That gives you somewhere to start investigating, but it doesn't necessarily capture the moment the app became unresponsive.
The component that timed out also isn't necessarily the one that caused the delay. Broadcast receivers, services and activities all run their callbacks on the main thread by default, and they take turns on it. So multiple small delays on the main thread can combine to become an ANR.
When the app is in the foreground, the user sees the ANR dialog, with options to wait or close the app. When it's in the background, Android usually kills the process silently. The user never sees a dialog but it can lead to unexpected results for the user, like lost data. During development, you can turn on "Show background ANRs" in Developer options to see a dialog for these too.
The five ANR types and their timeouts
Android reports an ANR for several different reasons. Finding which type of ANR you're solving for is the first step to diagnosis. It tells you which timeout applies and where to start looking in the thread dump. The five types below cover most of the ANRs apps see in production.
| ANR type | Fires when | Default timeout |
|---|---|---|
| Input dispatch | The main thread does not respond to an input event such as a tap in time. Common causes include heavy work on the main thread, main-thread I/O, synchronous Binder calls, or a deadlock with another thread. | 5 seconds |
| Service execution | A service does not return from onCreate(), onStartCommand(), or onBind() in time. | 20 seconds when the app is in the foreground, 200 seconds when it's in the background |
| Foreground service startup | A service started with startForegroundService() does not call startForeground() in time. | 10 seconds (documented only as "a few seconds") |
| Broadcast receiver | A receiver does not return from onReceive() before the deadline. | 10 seconds for foreground-priority intents, 60 seconds for other broadcasts. Android 14 and later: up to 20 or 120 seconds when the process is CPU starved |
| JobService callback | onStartJob() or onStopJob() takes too long to return, or a user-initiated job does not call setNotification() in time. | Callbacks: about 8 seconds, reported as ANRs only for apps targeting Android 14 or later. User-initiated jobs: setNotification() within 10 seconds |
These are the AOSP defaults. OEMs can change them, so if ANRs cluster on one manufacturer's devices, that manufacturer's timeouts may be shorter than the default.
Diagnosing different types of ANRs
On Android 11 and later, ApplicationExitInfo tells you why your app's process last exited. Call ActivityManager.getHistoricalProcessExitReasons() and look for entries with REASON_ANR. Each one has a thread dump from getTraceInputStream(), and the Subject: line in that dump says which type of ANR it was. The sections below cover each type.
1. Input dispatch ANRs
When the user taps the screen or presses a key, Android expects your app to handle the event within five seconds. If it doesn't, Android reports an input dispatch ANR. This usually happens when the main thread is busy with a heavy operation, like writing to a file, or is deadlocked with another thread. It can also be a combination of several smaller delays adding up.
Here's a shortened dump where the main thread is waiting for a lock:
Subject: Input dispatching timed out (fc03722 com.example.app/com.example.app.MainActivity is not responding. Waited 5011ms for MotionEvent(... action=DOWN ...)).

"main" prio=5 tid=1 Blocked
  at com.example.app.MainActivity.MainActivitylambda3101(MainActivity.kt:241)
  - waiting to lock <0x0e982a1a> (a java.lang.Object) held by thread 43
  ...

"APP: Locker" prio=5 tid=43 Sleeping
  at java.lang.Thread.sleep(Native method)
  - sleeping on <0x06c6e5d4> (a java.lang.Object)
  ...
The subject Input dispatching timed out tells us a user interaction couldn't complete. "Waited 5011ms" confirms the 5-second deadline.
The main thread is Blocked at MainActivity.kt:241, waiting to lock <0x0e982a1a>, which is held by thread 43, which happens to be in a Sleeping state.
Input dispatch ANR doesn't always involve a lock. Here's an example where the main thread is simply busy:
Subject: Input dispatching timed out (3b38947 com.example.app.debug/com.example.app.MainActivity is not responding. Waited 5006ms for MotionEvent(... action=UP ...)).

"main" prio=5 tid=1 Runnable
  at com.example.app.MainActivity.MainActivitylambda30$0(MainActivity.kt:220)
  at com.example.app.MainActivity.DemoCardlambda0$0(MainActivity.kt:559)
  at androidx.compose.foundation.ClickableNode.onPointerEvent-H0pRuoY(Clickable.kt:935)
  ...
When the main thread is Runnable it means it was executing code, not waiting. Here it's stuck inside a click handler. That points to expensive computation on the main thread.
Other input dispatch ANRs can involve main-thread I/O, synchronous Binder calls, or a thread that was runnable but got little CPU time.
StrictMode is useful for catching main-thread I/O during development. For the rest, you typically need more context about what the app was doing to get to the root cause.
There is another variant of this ANR called the no focused window ANR, which is not as common. It happens when Android has an input key event to deliver but can't find a focused window in your app to deliver it to. This usually means an activity was slow to start or resume and its window didn't get focus in time.
2. Service execution ANRs
When Android starts or binds to a service, it waits for onCreate(), and then onStartCommand() or onBind() to return. The timeout is 20 seconds when the app is in the foreground and 200 seconds when it's in the background.
The subject tells us which service timed out:
Subject: executing service com.example.app.debug/com.example.app.AnrService, waited 20017ms

"main" prio=5 tid=1 Sleeping
  at java.lang.Thread.sleep(Native method)
  - sleeping on <0x09d9e272> (a java.lang.Object)
  at java.lang.Thread.sleep(Thread.java:451)
  - locked <0x09d9e272> (a java.lang.Object)
  at java.lang.Thread.sleep(Thread.java:356)
  at com.example.app.AnrService.onStartCommand(AnrService.kt:20)
  ...
Android called onStartCommand(), and at the moment of the dump, the callback was still inside it at AnrService.kt:20, sleeping. Here the service isn't a foreground service, and it still hit the 20-second limit (waited 20017ms) because the app was in the foreground.
The subject format varies across Android versions. On Android 12, the same ANR reads just executing service sh.frankenstein.android/.AnrService, without the wait time.
The fix depends on what the service needs to do. Take an upload service, for example. If the uploads should survive the process being killed and be retried later, the service may not be needed: enqueue a worker and let WorkManager read and send the pending uploads. If the service needs to stay active while an immediate operation runs, have onStartCommand() start that operation on an executor or coroutine scope and return. Stop the service when the operation finishes. In neither case should onStartCommand() wait.
3. Foreground service startup ANRs
A service started with startForegroundService() must call startForeground() within a few seconds. Android's documentation says "a few seconds"; the platform default is currently 10 seconds.
Subject: Context.startForegroundService() did not then call Service.startForeground()

"main" prio=5 tid=1 Waiting
  at java.util.concurrent.FutureTask.get(FutureTask.java)
  at com.ex.app.RecordingService.prepareSession(RecordingService.kt:64)
  at com.ex.app.RecordingService.onStartCommand(RecordingService.kt:41)
  ...
In this illustrative example, onStartCommand() waits for prepareSession before calling startForeground(), which likely causes the delay.
You must call startForeground() as soon as the service is ready to become a foreground service. The same root cause can also show up as a crash rather than an ANR:
android.app.RemoteServiceException$ForegroundServiceDidNotStartInTimeException:
    Context.startForegroundService() did not then call Service.startForeground()
4. Broadcast receiver ANRs
A broadcast receiver ANR happens when a receiver fails to return from onReceive() before the deadline. The deadline is 10 seconds when the intent has FLAG_RECEIVER_FOREGROUND set, and 60 seconds otherwise. On Android 14 and later, Android can extend this to up to 20 or 120 seconds when the process is CPU-starved.
Subject: Broadcast of Intent { flg=0x10000010 cmp=com.ex.app.debug/com.ex.app.BroadcastReceiver }

"main" prio=5 tid=1 Blocked
  at com.example.app.AnrBroadcastReceiver.onReceive(BroadcastReceiver.kt:11)
  - waiting to lock <0x03fecde6> (a java.lang.Object) held by thread 44
   ...
"Thread 9" daemon prio=5 tid=44 Sleeping
  at java.lang.Thread.sleep(Thread.java:356)
  at com.ex.app.BroadcastReceiver.triggerlambda$0(BroadcastReceiver.kt:24)
  - locked <0x03fecde6> (a java.lang.Object)
  at java.lang.Thread.run(Thread.java:1119)
The subject contains the receiver in cmp=. The flg=0x10000010 value includes FLAG_RECEIVER_FOREGROUND, so the 10-second deadline applied. Following the lock leads to thread 44, which is sleeping while holding the lock, thereby causing an ANR.
5. JobService callback ANRs
JobService.onStartJob() and onStopJob() run on the main thread and need to return within about 8 seconds. If your app targets Android 14 or later and runs on an Android 14+ device, taking too long in these callbacks produces an ANR. On older targets or devices, JobScheduler stops the job, and it fails silently, with no ANR reported to the app.
Subject: No response to onStartJob

"main" prio=5 tid=1 Sleeping
  at java.lang.Thread.sleep(Thread.java:451)
  - locked <0x05f020c5> (a java.lang.Object)
  at java.lang.Thread.sleep(Thread.java:356)
  at com.example.app.AnrJobService.onStartJob(AnrJobService.kt:23)
  at android.app.job.JobService$1.onStartJob(JobService.java:118)
  at android.app.job.JobServiceEngine$JobHandler.handleMessage(JobServiceEngine.java:171)
  at android.os.Handler.dispatchMessage(Handler.java:109)
  ...
The ANR job above failed to call finish onStartJob in time, causing an ANR.
The ANR can also happen when the callback is fast, but the main thread is busy with something else, so onStartJob() never gets to run in time. User-initiated jobs have another deadline: they must call setNotification() within 10 seconds of onStartJob().
Why the stack trace often names the wrong code
The examples above have a useful stack frame to follow. Production traces aren't always that clear. You may see a lot of stack traces with an idle main thread, waiting in nativePollOnce.
"main" prio=5 tid=1 Native
  at android.os.MessageQueue.nativePollOnce(Native method)
  at android.os.MessageQueue.next(MessageQueue.java)
  at android.os.Looper.loop(Looper.java)
For an input dispatch ANR, the main thread may have been blocked earlier and recovered before the dump was taken. The report in such cases is not actionable and can be ignored; if this was a real ANR, it will show up in other reports with a better actionable stack trace.
For a broadcast receiver ANR, an idle main thread can be completely expected. If the receiver called goAsync(), onReceive() may already have returned while Android is still waiting for PendingResult.finish(). Inspect the broadcast receiver's worker threads and the paths that call finish().
For a service execution ANR, check whether the service callback ever ran. The main thread might have finished a slow callback before the dump, or the service may have been delayed by process startup or work from another component. The service named in the description tells you what timed out; an idle main thread alone cannot tell you which of those happened.
For a foreground service startup ANR, it typically means that startForeground() was delayed. The reason might be something happening within the service before startForeground is called, or a delay on the main thread that prevents the service from starting up.
In many cases, the stack trace may not be sufficient. This is where a tool like session replay can help. We'll look at how Measure's session replay can help debug difficult-to-solve ANRs.
What actually moves your ANR rate
Android vitals judges ANRs on the user-perceived ANR rate. This is a core vital, and it affects how discoverable your app is on Google Play. It measures the percentage of daily active users who experienced at least one user-perceived ANR. There are two bad behavior thresholds:
- At least 0.47% of daily active users experience a user-perceived ANR, across all device models.
- At least 8% of daily active users experience one on a single device model.
Only input dispatch ANRs ("Input dispatching timed out") count as user-perceived, because they always happen while the user is using the app. Service, broadcast and job ANRs still count toward the overall ANR rate you see in Play Console, but not toward the core vital. If your goal is to get under the threshold, start with input dispatch ANRs.
A triage workflow for a production ANR cluster
When a group of ANRs shows up in production, work through it in this order before changing any code:
- Read the subject: It tells you the ANR type. For services and broadcasts, it also names the component (look for
cmp=in a broadcast subject). On Android 11, where the subject is often missing, look for the entry frame instead:handleServiceArgs,handleReceiver,JobServiceEngine$JobHandleror an input handler. - Check for
handleBindApplication: If it's on the main thread, treat the ANR as a startup problem. - Find the main thread and read its state:
Blocked: follow the lock address to the holder thread and look at what the holder is doing.Runnable: the top app frames are doing too much work. Checkschedstatto rule out CPU starvation.Waiting/TimedWaiting: find what it's waiting on, such as a future, a latch or another thread.NativeinBinderProxy.transactNative: a synchronous call to another process.NativeinnativePollOnce: this dump doesn't show the cause. Move to another report in the group.
- Check the entry frame against the ANR type: For a service, broadcast or job ANR, the callback named in the subject should be on main's stack. If it isn't, it means the main thread was busy with something else first.
- Compare several reports in the group: Frames that show up across many reports are a stronger lead than any single report.
- Look at what the app was doing before the ANR: When the main thread is idle, you need the session context.
- Look for patterns across sessions. Check whether the same screen, action, device model or OS version shows up before most of the ANRs.
Solving ANRs with Session Replay
For difficult-to-solve ANRs, we want to know what the app was doing in the seconds or minutes before it became unresponsive.
Measure automatically attaches the preceding session replay to every ANR. By default this includes the five minutes before the ANR.
The replay puts session events on a timeline: screen views, user gestures, lifecycle events, network requests, logs and errors, and CPU and memory usage. Layout snapshots and screenshots can also show what was on screen.
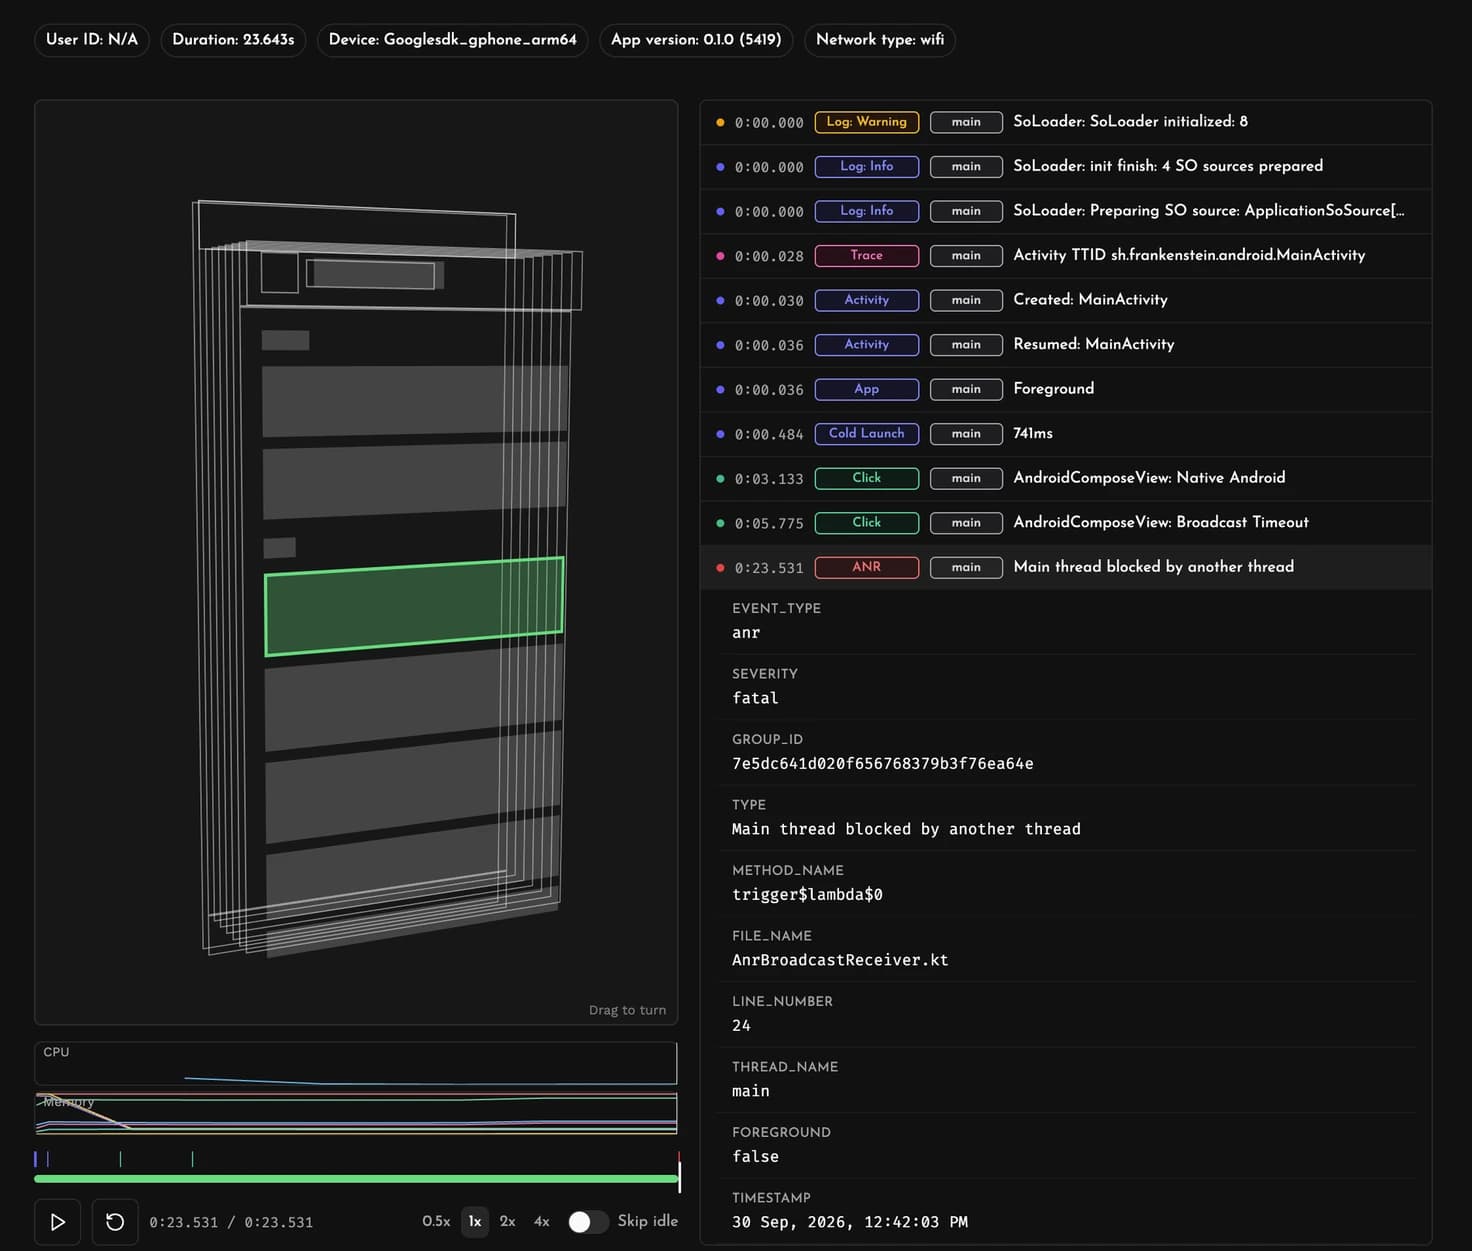
This gives us a few more places to look when the stack trace isn't enough.
Check what happened before the ANR
Start from the ANR and work backwards through the timeline.
If this is an input dispatch ANR, look at the last few interactions. Which screen was the user on? What did they tap? Was there a navigation immediately before the app stopped responding? Did that interaction start a network request or some other work?
For a service or broadcast ANR, look for the lifecycle and application events around the same time. This can help establish whether the app had just started, returned from the background, or was already busy doing something else when the component was started.
This is particularly useful for an ANR whose dump contains nativePollOnce.
Check CPU and memory around the ANR
Measure records CPU and memory usage throughout the session.
A CPU spike leading into an input dispatch ANR is a good reason to investigate expensive computation, rendering or a burst of work happening at that point in the session. If the CPU stays high for a longer period, also look at other work in the process rather than assuming the main thread alone caused it.
Memory gives us another useful signal. A sharp increase in memory before the ANR can point to the app allocating heavily or working on a large amount of data. It doesn't prove that memory caused the ANR, but it gives you another part of the session to investigate.
Compare more than one occurrence
Don't rely too much on a single session.
If the same ANR happens across several sessions, compare what happened before each occurrence. One session may have an unrelated CPU spike or network request. If the same screen, interaction, request or resource spike keeps showing up before the same ANR, that is a much stronger lead.
At this point, opening sessions one by one doesn't scale very well. What we really want to ask are questions across all the affected sessions: What screens were users on before the ANR? Did memory or CPU spike? Was the same network request running? What events commonly happened in the last 30 seconds?
This is where having queryable telemetry becomes useful. Instead of investigating each ANR separately, we can give an agent access to the affected sessions and let it look for patterns across them.
Investigate ANRs with Measure MCP
Measure exposes its data through an MCP server, which means a coding agent can query the production telemetry while investigating the issue.
Instead of giving the agent a single stack trace, we can ask it to investigate an ANR across multiple sessions. It can look at the thread dumps, inspect the events leading up to each ANR, compare CPU and memory usage, and look for things that repeatedly happen across affected sessions.
The result is not that the agent magically knows why the ANR happened. It has the same job we had above: use the ANR type and thread dump to form a lead, then use the surrounding production data to test it. The difference is that it can do this across many sessions instead of us opening and comparing them one at a time.
FAQs
How long does an app have to respond before an ANR?
It depends on what Android is waiting for:
- Input events (taps, key presses): 5 seconds.
- Broadcast receivers: 10 seconds for intents with
FLAG_RECEIVER_FOREGROUND, 60 seconds for the rest. On Android 14 and later, Android can extend this to up to 20 or 120 seconds when the process is starved of CPU. - Services: 20 seconds when the app is in the foreground, 200 seconds when it's in the background. This includes starting the process if it wasn't running.
startForeground()afterstartForegroundService(): a few seconds, 10 seconds on current Android versions.JobServicecallbacks: about 8 seconds, reported as an ANR only for apps targeting Android 14 or later. User-initiated jobs must callsetNotification()within 10 seconds.
These are the AOSP defaults. Some device manufacturers change them, so if one manufacturer's devices account for a lot of your ANRs, their timeouts may be shorter.
What does "Input dispatching timed out" mean?
Your app didn't finish handling a tap or key press within 5 seconds. It's the most common ANR type, and the only one that is counted in Android vitals towards bad behaviour thresholds. The subject line includes the activity that triggered the event and how long Android waited; for example, Waited 5011ms for MotionEvent. Look at the main thread: it's usually blocked on a lock, busy with work, doing I/O or waiting on a Binder call. See Input dispatch ANRs for examples.
Why does my ANR stack trace show nativePollOnce?
nativePollOnce means the main thread was idle, waiting for its next message, when Android collected the stack trace. The stack trace is taken after the timeout has passed, so the main thread may have finished whatever was blocking it by then.
What it means depends on the ANR type:
- Input dispatch: this report doesn't show the cause. Look at other reports in the same group, which often catch the main thread mid-work, and at what the app was doing before the ANR.
- Broadcast receiver: if the receiver uses
goAsync(), main can be idle while Android waits forPendingResult.finish(). Look at the threads doing the receiver's work. - Service: the callback may have finished just before the dump, or the service may have been delayed by process startup or other work on main.
In every case, the ANR did occur. It's only the stack that arrived too late to show it. The session replay of the minutes before the ANR is often the only way to see what the main thread was doing.
Can an ANR happen without the user seeing a dialog?
Yes. When the app is in the background, Android usually collects the ANR trace and kills the process without showing a dialog. This is common for service, broadcast and job ANRs. The user may never notice, but the ANR still counts toward your overall ANR rate in Play Console. It doesn't count toward the user-perceived ANR rate, which only includes input dispatch ANRs.
To see a dialog for background ANRs during development, turn on "Show background ANRs" in Developer options. In production, ApplicationExitInfo.getImportance() tells you whether the app was in the foreground or background when it stopped responding.
How do I get the ANR trace off a device?
On an emulator or a userdebug build, pull it from /data/anr with root:
adb root
adb shell ls /data/anr
adb pull /data/anr/<filename>
On a regular phone, run adb bugreport, which includes the ANR traces without needing root. For ANRs on your users' devices, read the trace from ApplicationExitInfo.getTraceInputStream() when the app next starts, or use a tool that does it for you. Measure collects the trace automatically, deobfuscates it if you upload mapping files, and groups similar ANRs.
How do I fix an ANR in Android?
Start with the subject line to find the ANR type, then read the main thread's state in the thread dump:
Blocked: find the thread holding the lock, and stop it doing slow work while it holds the lock.Runnable: move the expensive work off the main thread.Nativein a Binder call: make the call asynchronous.- In a component callback (
onReceive(),onStartCommand(),onStartJob()): return quickly and do the work on another thread, or with WorkManager.
If the stack trace doesn't show the cause, compare several reports in the same group and look at what the app was doing before the ANR. The triage workflow section above goes through this step by step.