


Mobile App Funnels: Find the issues that sabotage core flows
Track your app's core flows, monitor them across releases and fix the issues that cause users to drop off.

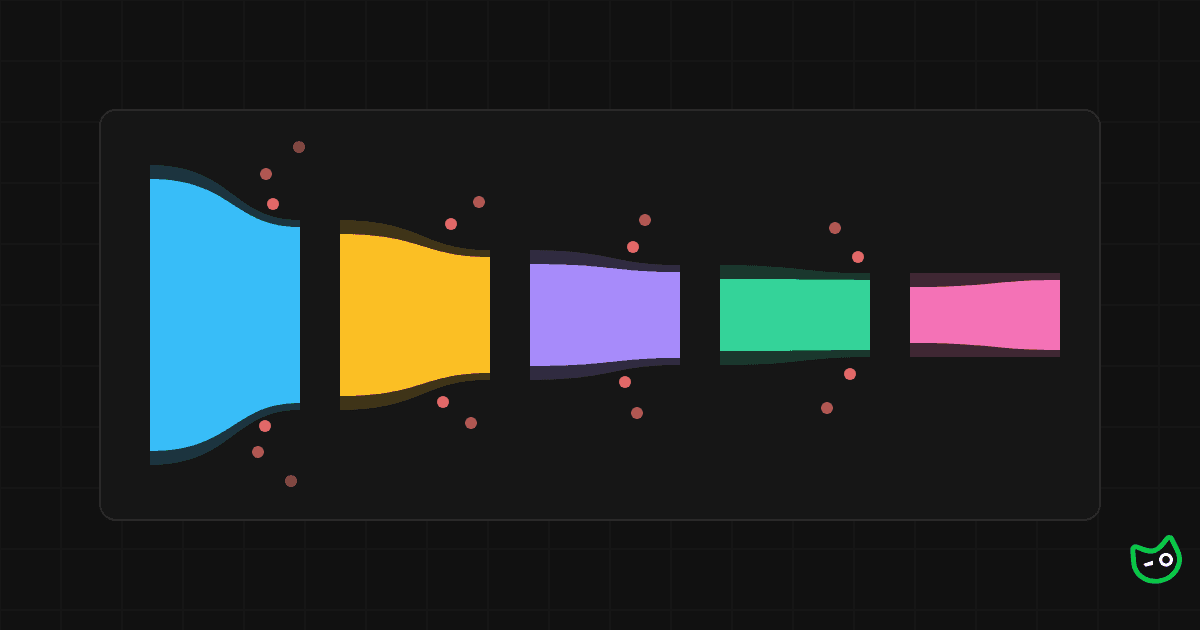
Most apps have a core set of flows that need special attention: signing up, searching for something, checking out, booking a ride. When fewer users finish one of these flows than usual, it shows up first as a business metric, and only later as a question for the engineering team.
Answering that question is harder than it should be. A product analytics tool can show that users are dropping off between adding to cart and checkout, but it doesn't know that a crash on the cart screen started with the last release. A crash reporting tool shows the crash, but it doesn't know that most of the users who encountered it didn't placed their order. The two sets of data are in different tools, and connecting them means exporting user lists, matching IDs and in many cases, just guessing.
We built Funnels in Measure to put both in one place. A funnel tracks how many users move through a flow, and for the users who dropped off, it shows the errors, slow traces and network requests that adversely affected their experience.
What is a funnel?
A funnel is a sequence of steps that users are expected to go through in order, like viewing a product, adding it to the cart, starting checkout, submitting payment and placing the order. For each step, a funnel counts how many users reached it, how many dropped off before it, and how long they took to get there from the previous step.
In Measure, each step is a custom event that the app sends. For example, in the Android SDK, you would use trackEvent:
import sh.measure.android.Measure

Measure.trackEvent("product_viewed")
Measure.trackEvent("added_to_cart")
Measure.trackEvent("checkout_started")
Measure.trackEvent("payment_submitted")
Measure.trackEvent("order_placed")
The same mechanism is available in the iOS, Flutter, React Native and Kotlin Multiplatform SDKs.
A funnel also has a conversion window, which is how long a user has to get from the first step to the last. For a ride booking, a 10 minute window might be reasonable. For an onboarding flow, it could be several hours or a day if steps like KYC are involved.
Counting conversions
A user enters the funnel when they trigger the first step's event, and converts when they send the remaining steps in sequence within the conversion window. Other events in between don't affect the result, so a user who views a few more products before checking out still counts as a conversion.
A conversion can also span several sessions. With a one day window, a user who adds a product to the cart in the morning and places the order in the evening in two separate sessions counts as a conversion.
Breakdown and drop-offs
The breakdown shows how many users reached each step in the selected date range. Hover to see conversion between steps, how many users dropped off, and the median time to progress from the previous step.
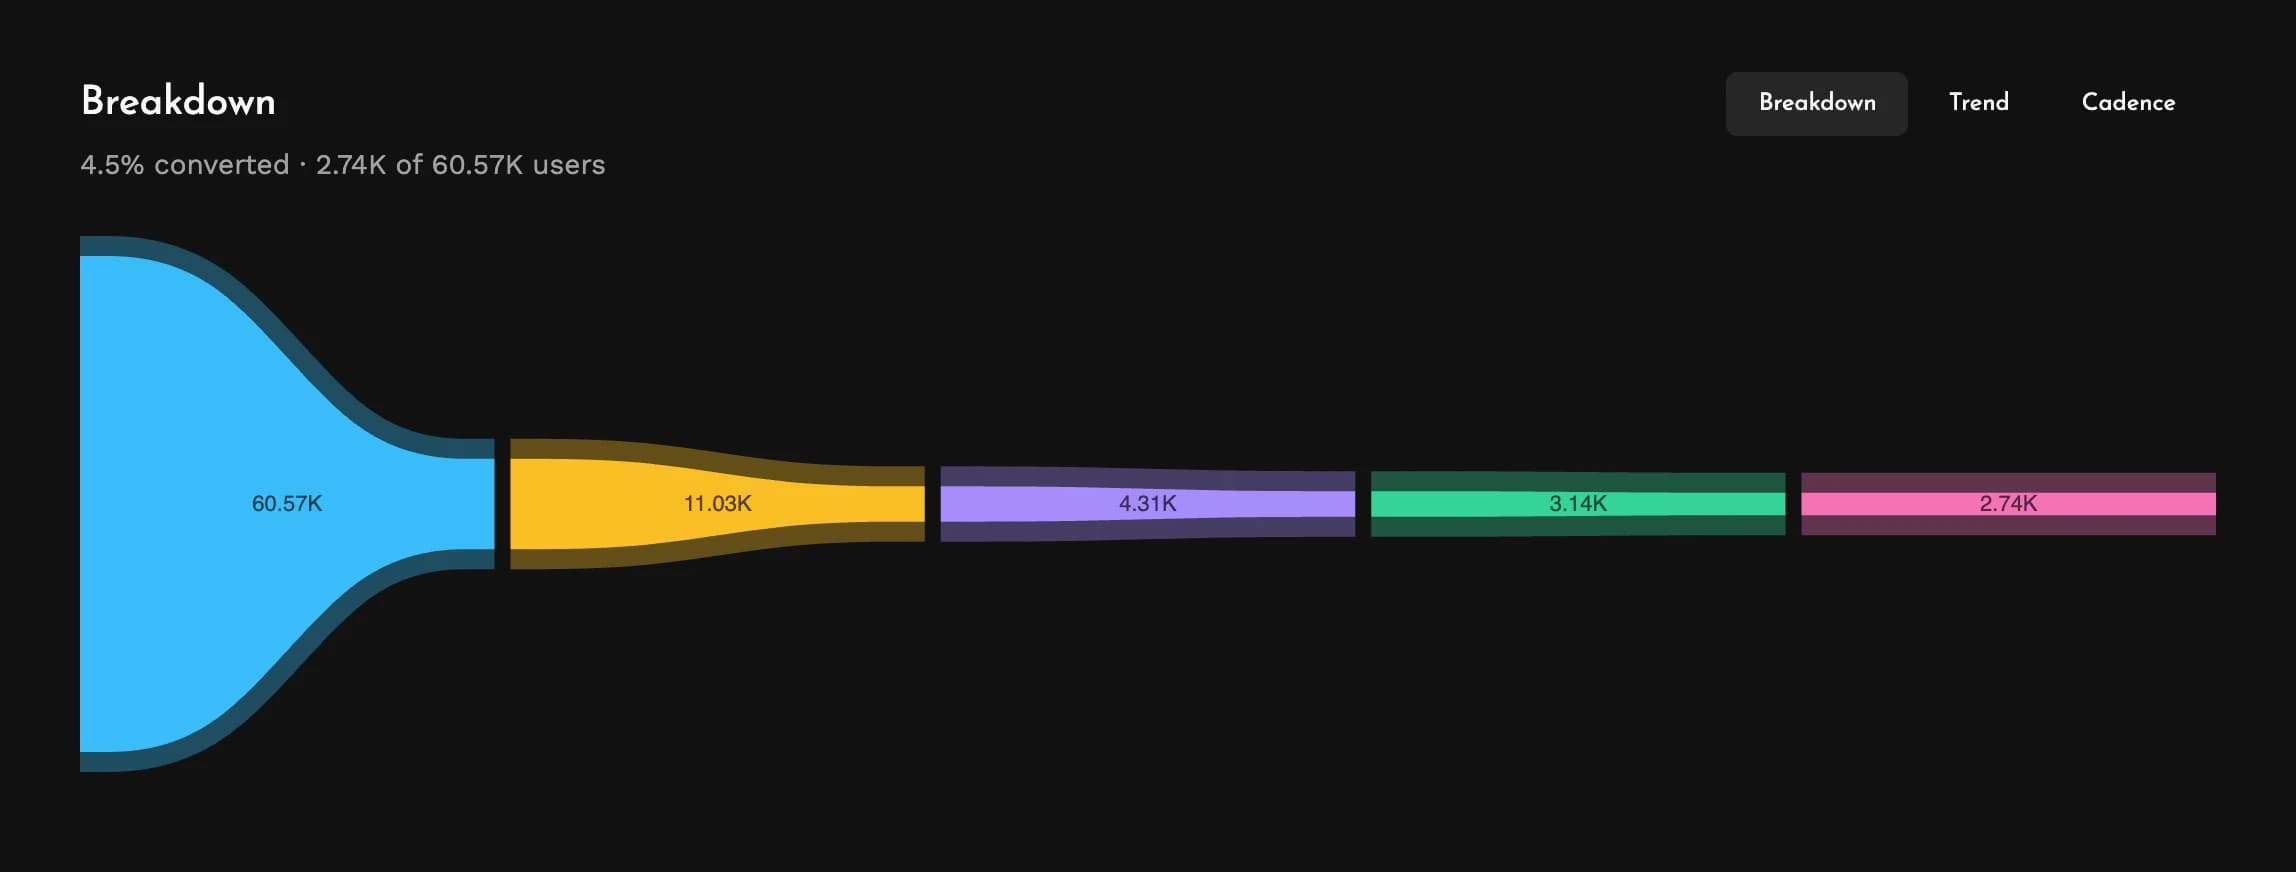
In this checkout funnel, 60.57K users viewed a product and 2.74K placed an order. Most of the drop-off is between the first two steps, which is common for browsing, while the later steps lose fewer users. A large drop between two steps that should follow each other closely, like payment submitted and order placed, is usually worth a closer look.
Trends
The trend view shows conversion over the last 30 days, 12 weeks or 12 months. Lines indicate how conversion changes over time for each step. You can switch to time to convert to see how long users take from the first step to the last.
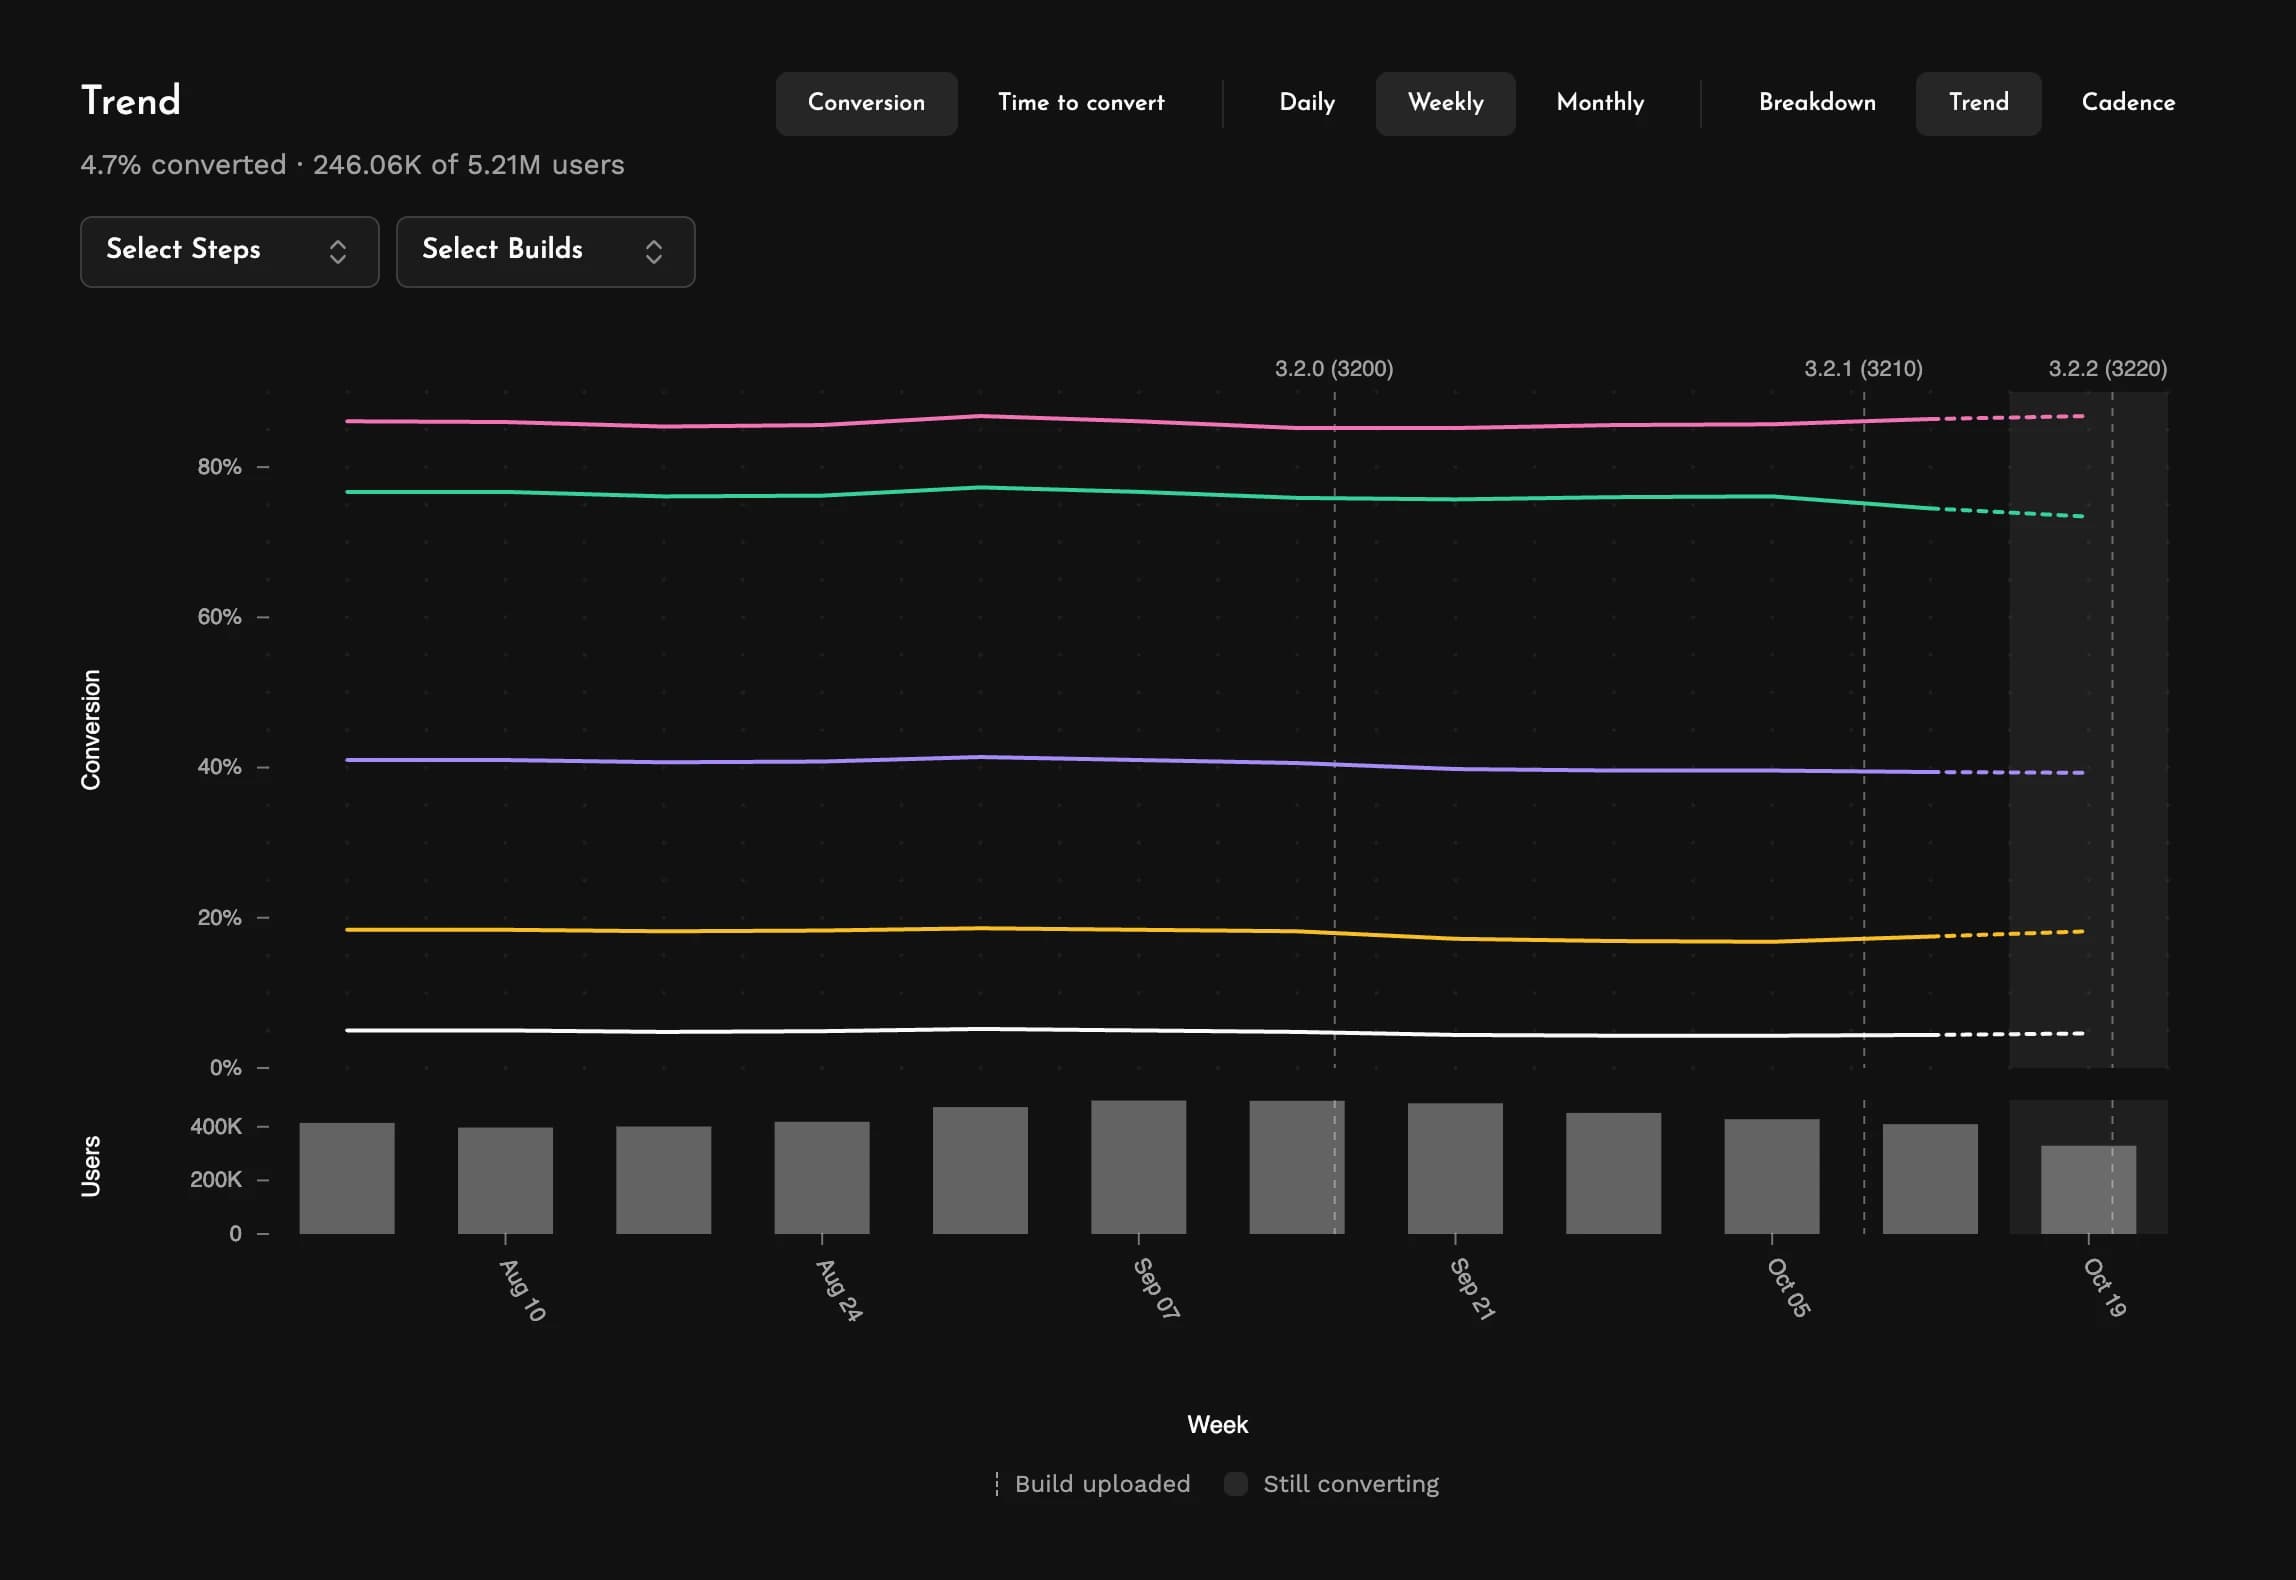
Each build you upload is marked above the plot. This gives you a quick way to see if a recently rolled out release is correlated with users dropping off in your core app flows.
Cadence
The cadence view shows conversion for each hour of the day and each day of the week, over the last 1, 4 or 12 weeks, allowing you to spot anomalies in regular patterns.
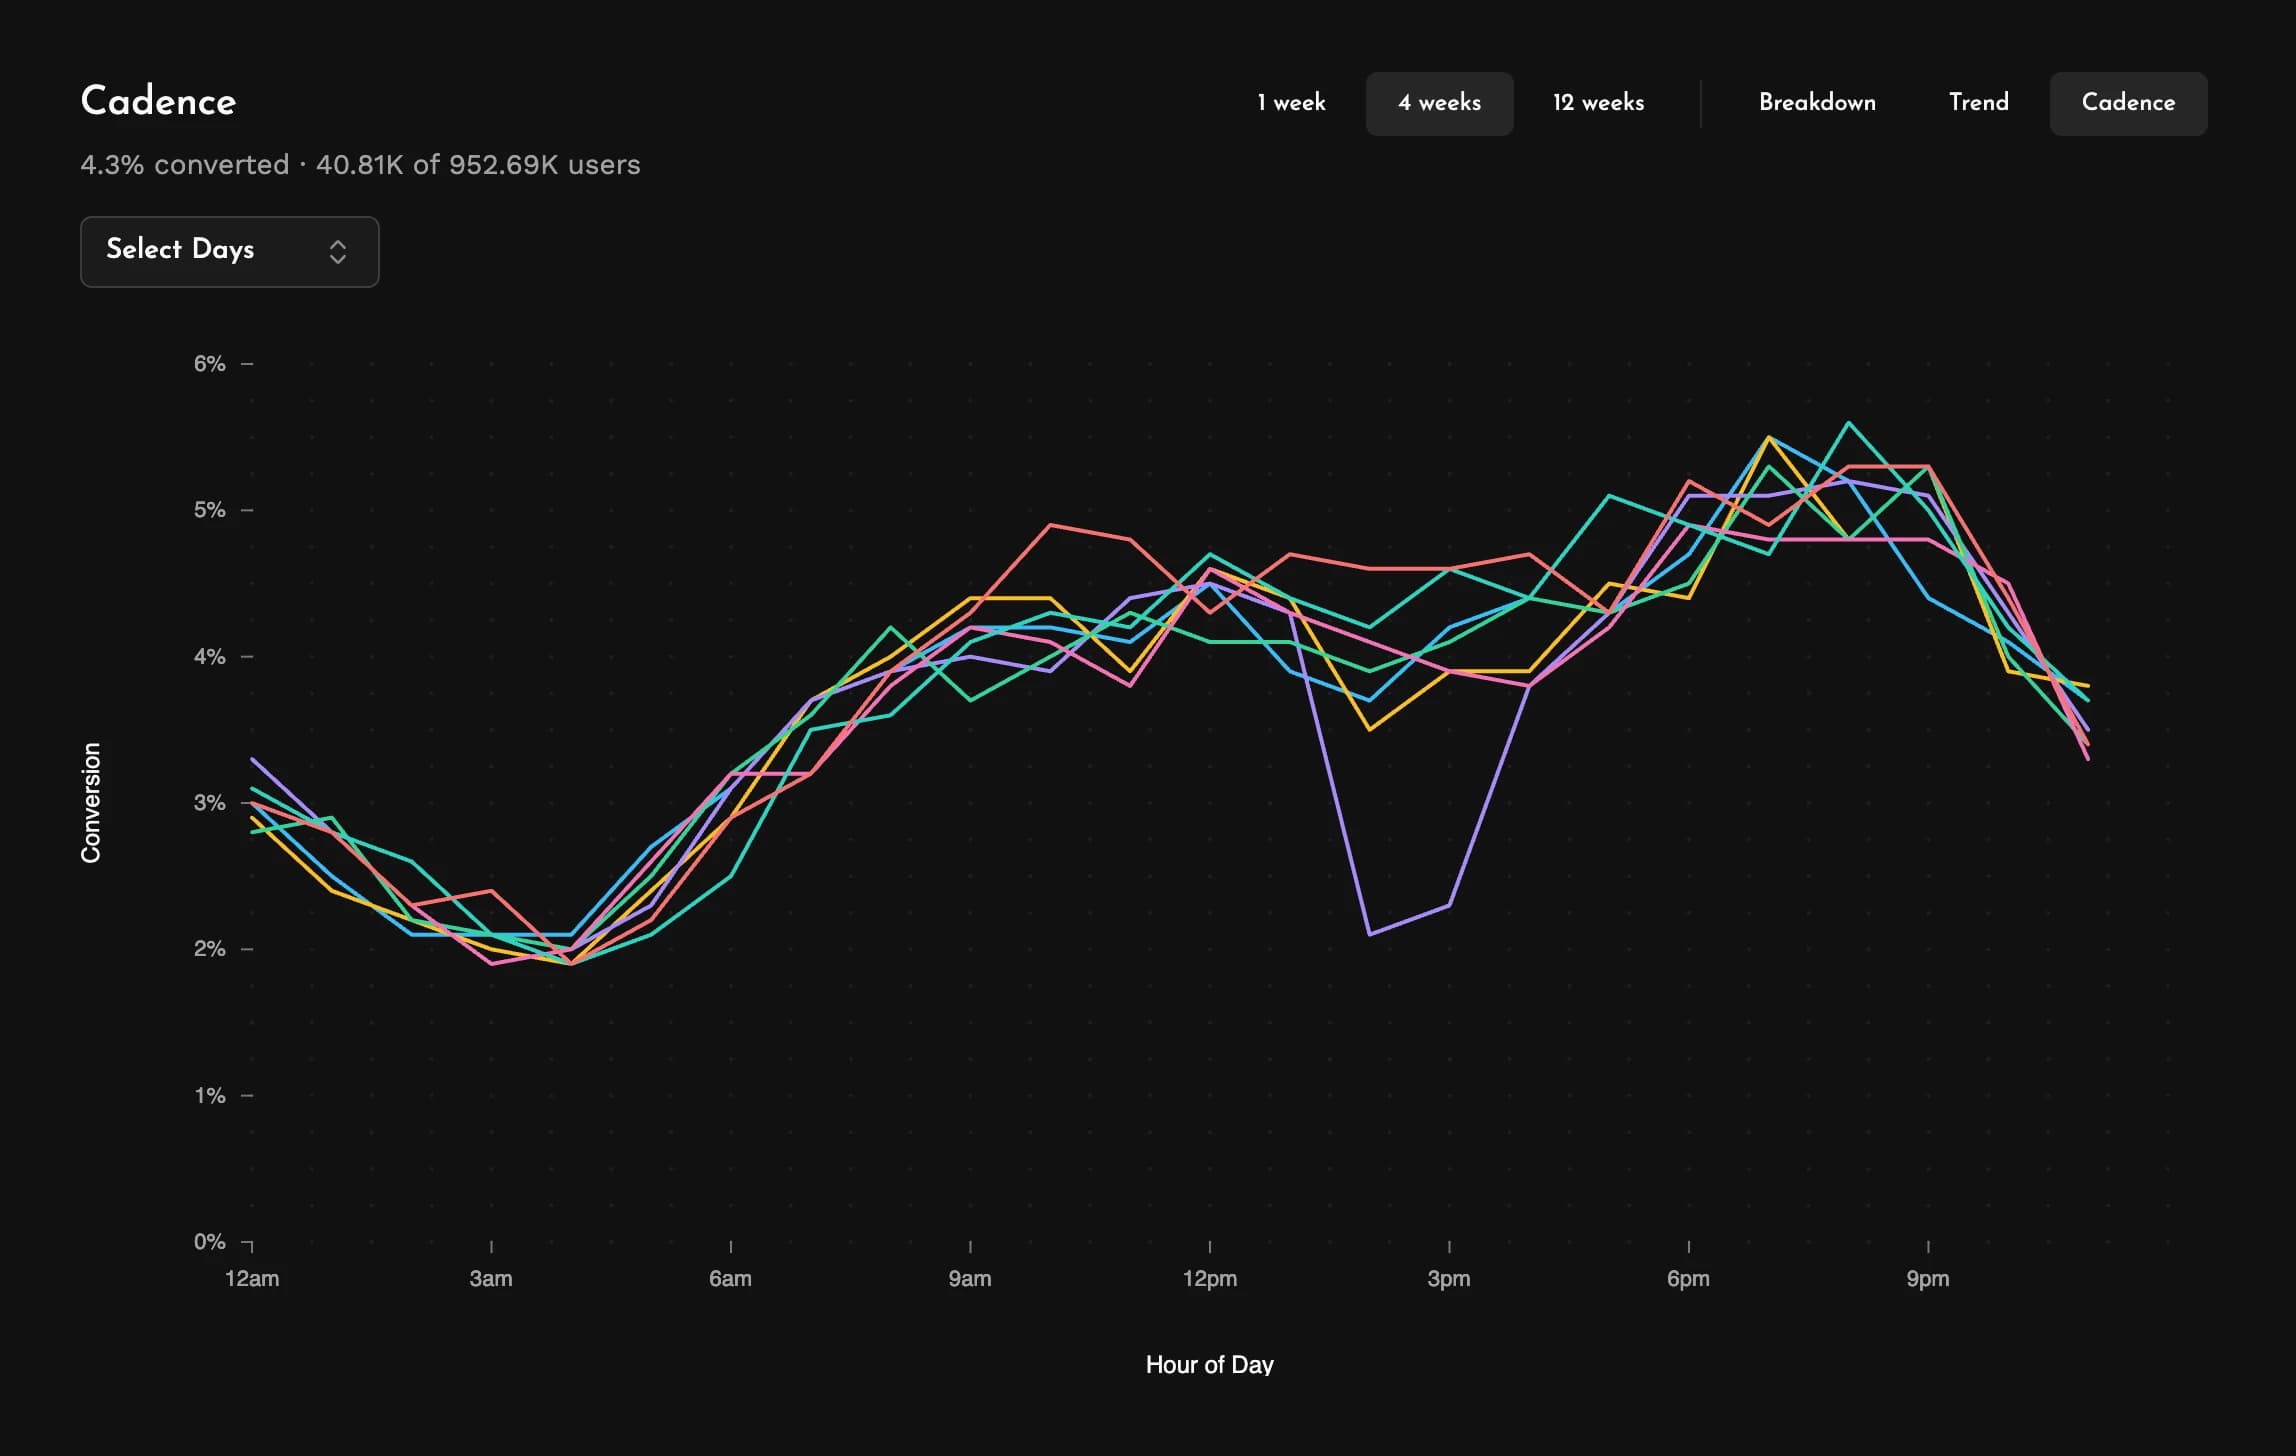
Most apps have a rhythm: high user activity in the morning for a stock trading app, elevated ride bookings after work hours for a transportation app and so on. A change that breaks the pattern, like the one in the early afternoon on one weekday above, can point at something unusual and quickly inform you that more investigation is needed.
Friction
Knowing where users drop off is only half of the problem. The friction view shows you what issues they faced. Measure compares the issues faced by users who converted against the users who didn't.
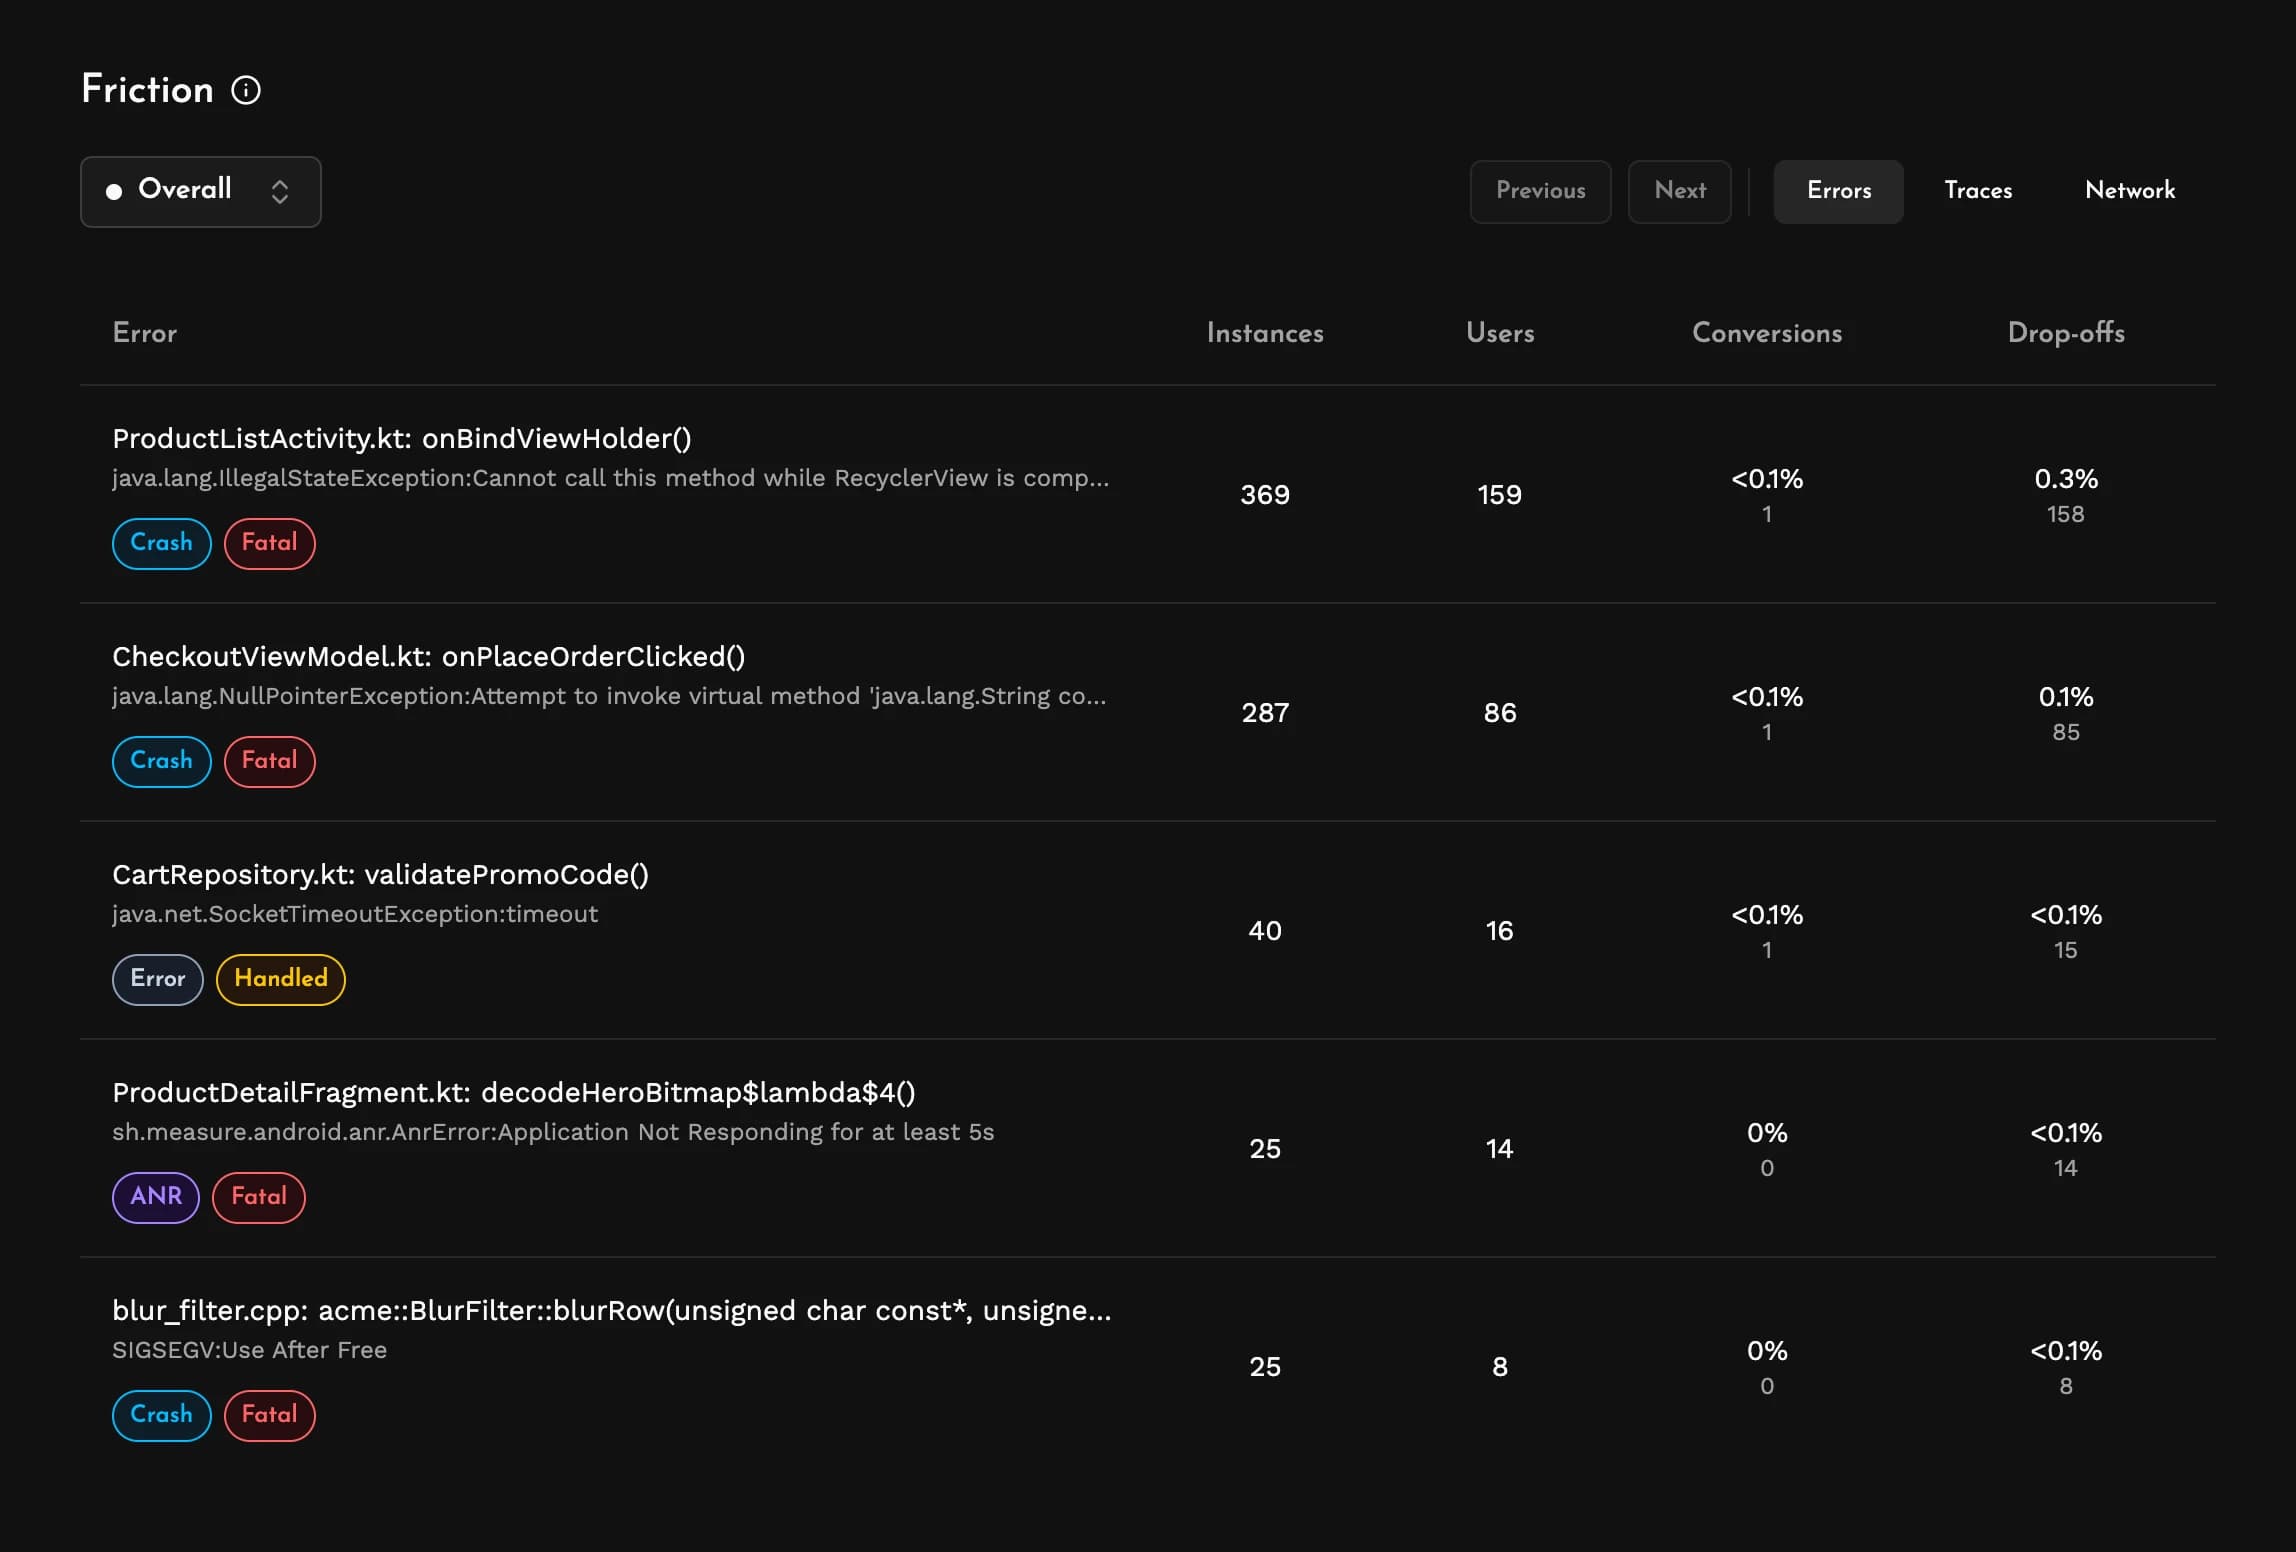
For any step or the overall funnel, you can see:
- Errors showing crashes, ANRs, app hangs and handled errors, with how many users ran into each one and how many of them converted or dropped off.
- Traces showing root spans, with their duration at p50, p90, p95 or p99 for the users who converted and for those who dropped off.
- Network showing requests grouped by URL pattern, with their latency for both groups.
Issues causing the highest drop-offs are shown first. In the list above, a crash in ProductListActivity affected 159 users, and 158 of them dropped off. A handled timeout in validatePromoCode() affected fewer users, but almost all of them left as well. Both are reasons users didn't finish checking out, and the drop-off count can help prioritize which to address first.
Traces and network requests also follow the same behavior. If the payment request takes twice as long at p90 for the users who dropped off against those who converted, that's a reasonable starting point for a fuller investigation.
Session Replays
The friction view shows the issues that users ran into, and session replays give you the rest of the context. For any step, you can open the sessions of the users who converted or dropped off and see the screens they visited, interactions they triggered, network requests, logs, errors, and CPU and memory usage.
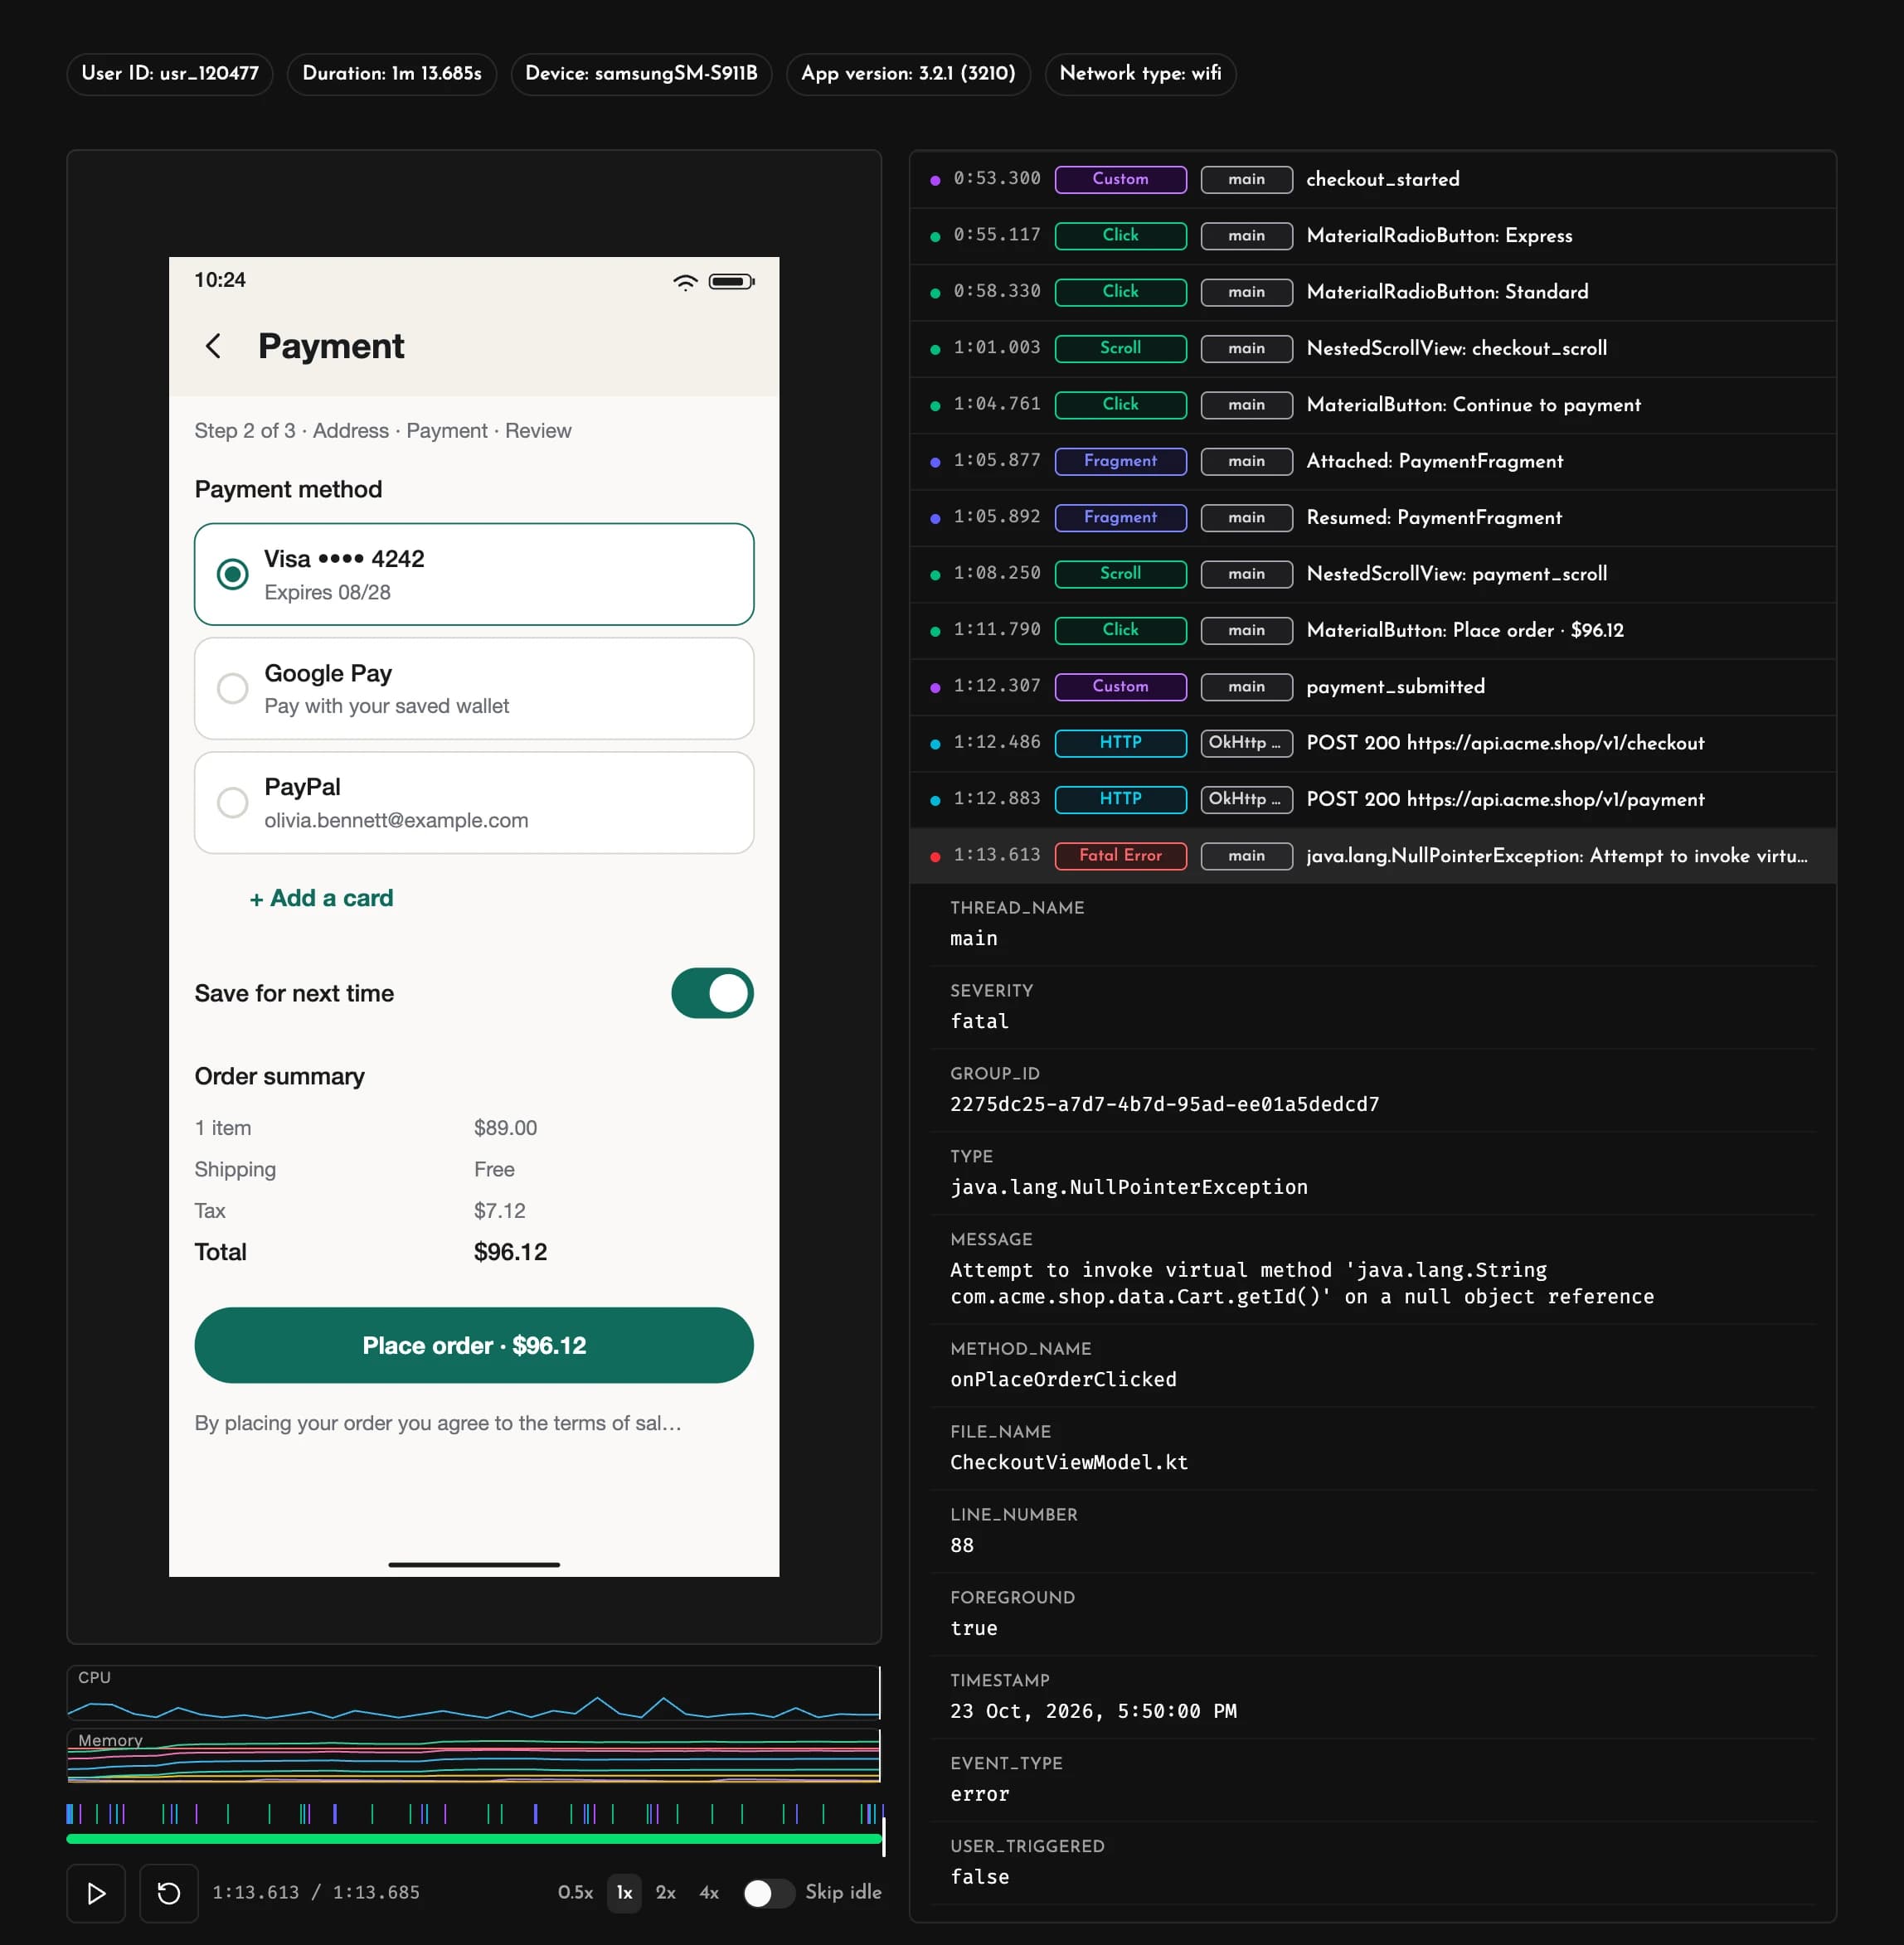
Comparing a few sessions from each group often makes the difference clear: the users who dropped off perhaps saw a loading screen that got stuck, or were sent back to the cart after a failed payment.
Filters
Funnels support the same filters as the rest of the dashboard, so you can compare conversion across app versions, OS versions, devices, network types, countries and more. You can also filter on custom attributes set in your app, like a feature flag or an experiment group.
Pinned Funnels
Funnels that the team checks frequently can be pinned to the top of the Funnels page. Each pinned funnel shows weekly conversion trends, week-over-week changes for the most recently completed week, the number of users who entered, the median time to convert, and the step with the highest drop-off.
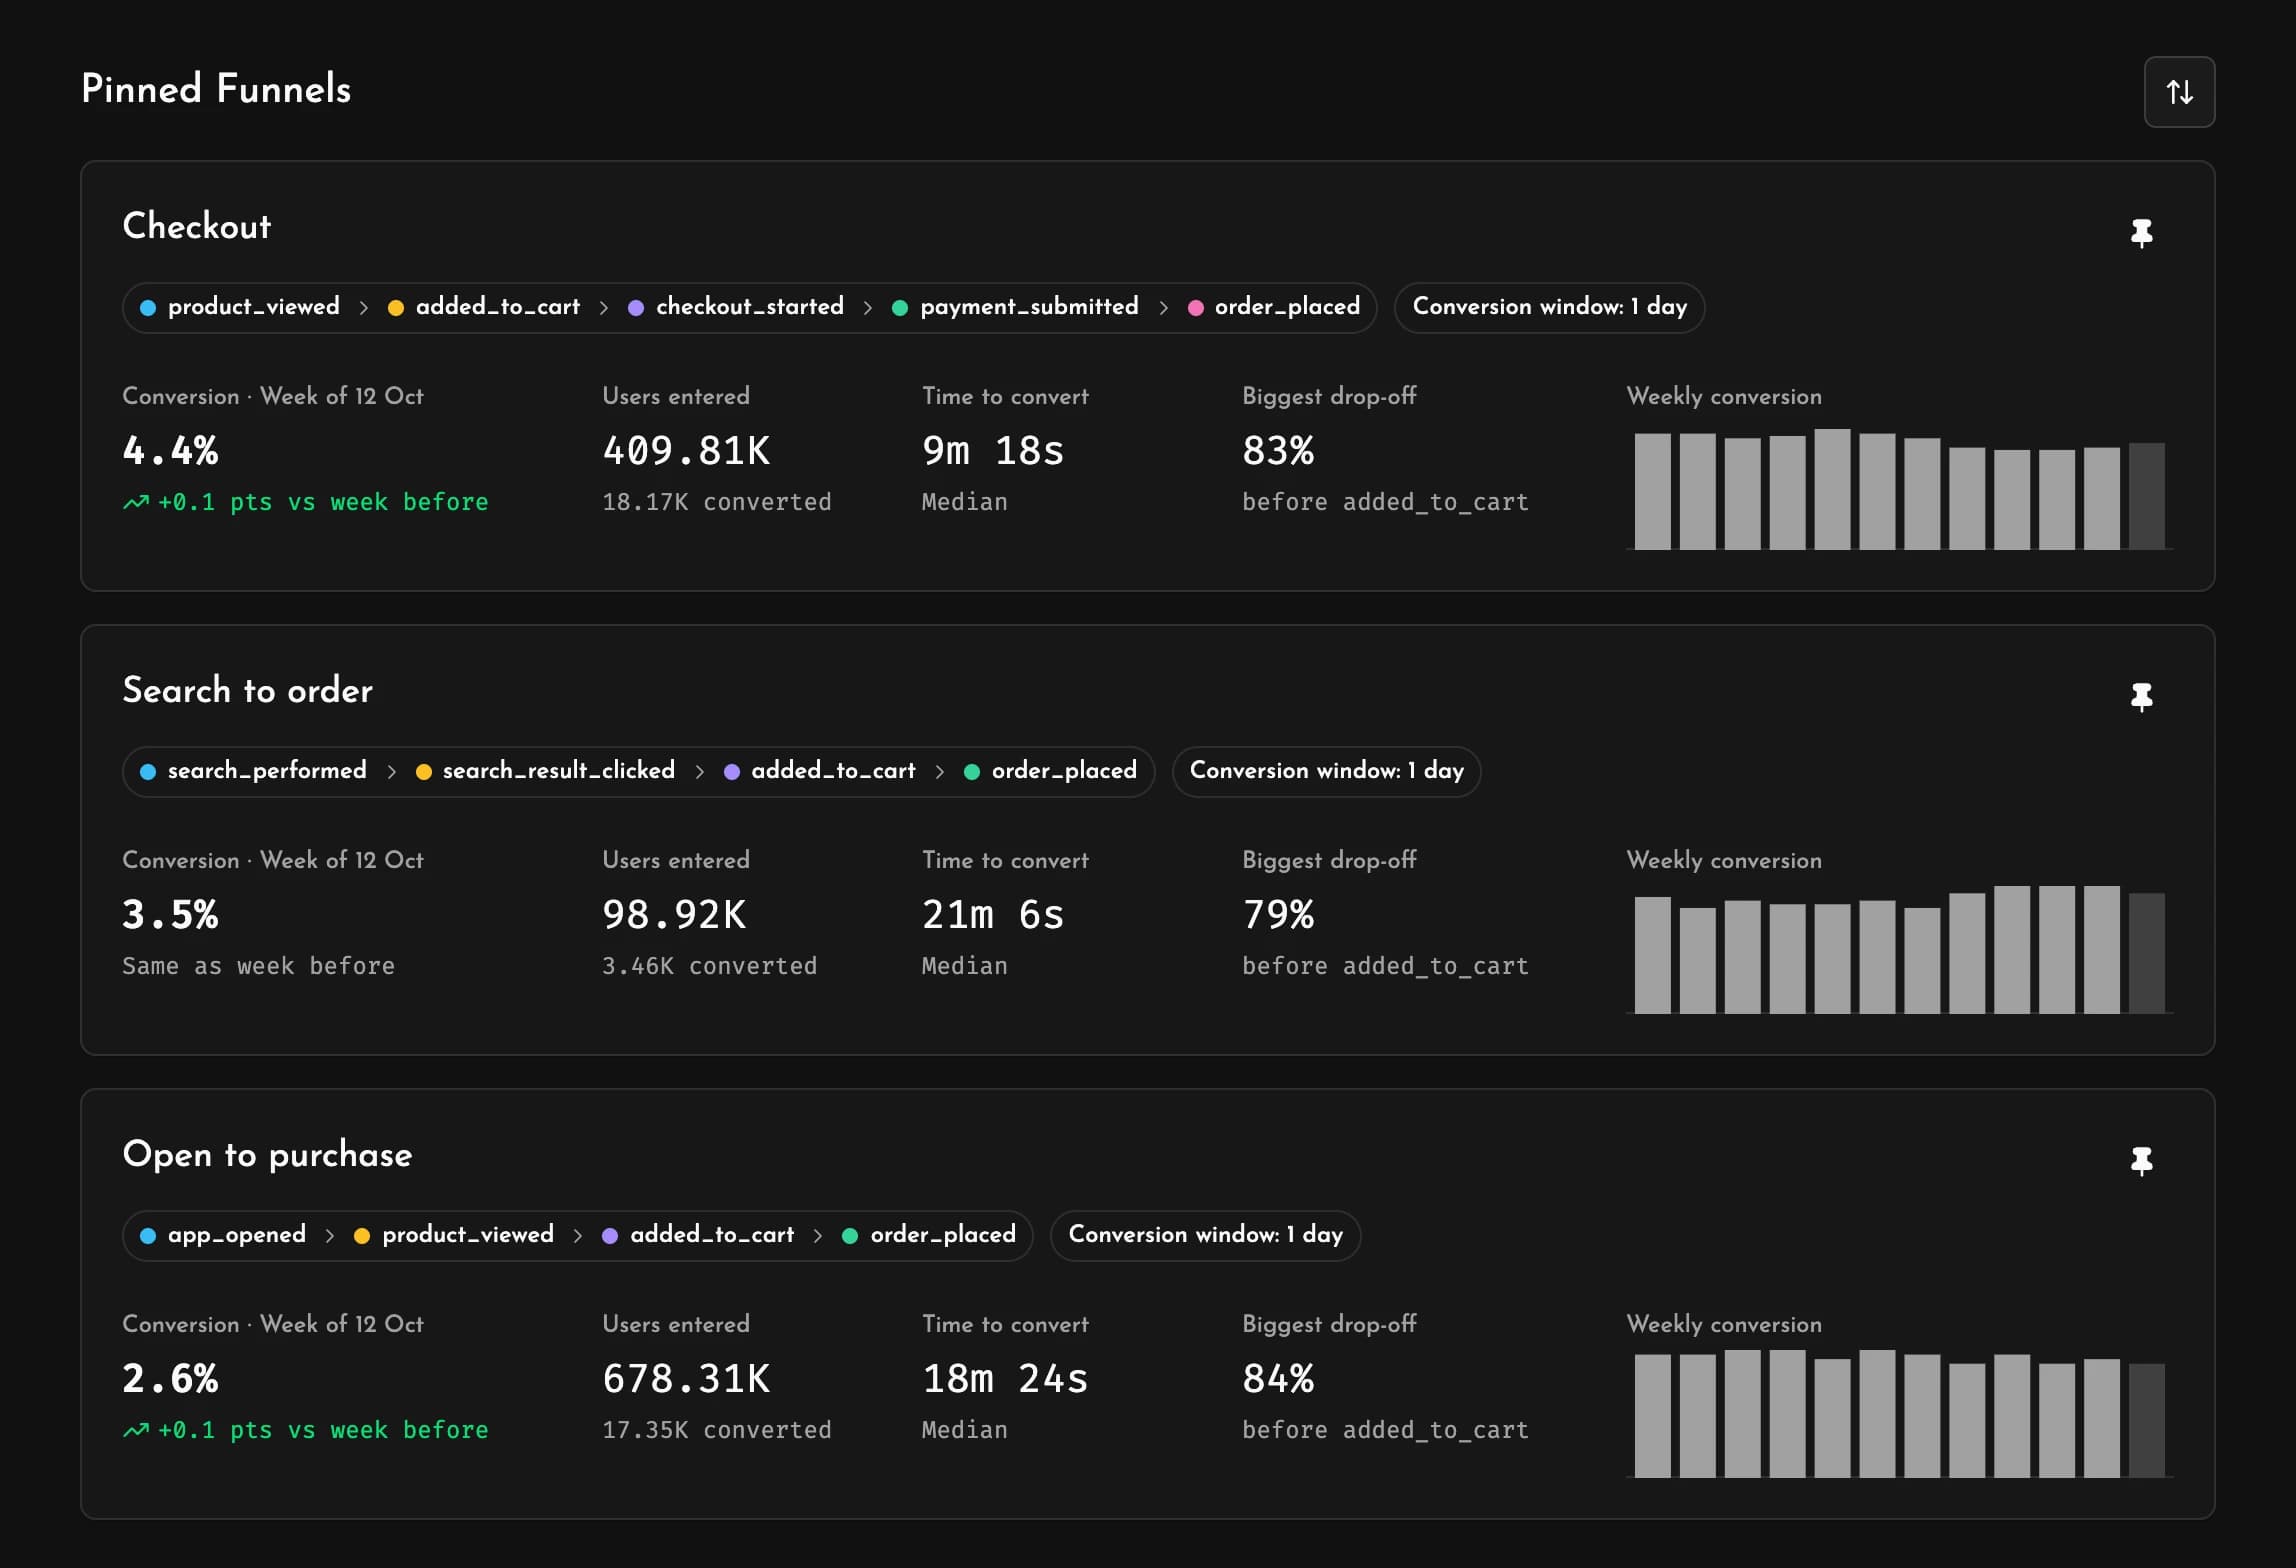
Pinned funnels can be re-ordered and are a great way for your whole team to share a view of important flows.
Funnels over MCP
Coding agents connected to Measure's MCP server can read and analyze funnels for you. Everything you can do from the dashboard, your agents can do from MCP. You can ask an agent why conversion dropped in the newest release, and it can look at the issues affecting the step that lost users, investigate the errors and traces involved, and help you fix them.
Getting started
Send your custom events, then open Funnels on the dashboard and create a funnel with its steps and a conversion window. Funnels work with all of Measure's SDKs, and since they're calculated from events already collected, any custom events your app already sends can be used right away. See the Funnels docs for the details.
You can also try a demo funnel in the interactive demo without setting anything up.
FAQ
What is a conversion funnel in a mobile app?
A conversion funnel is a sequence of steps users go through to complete a flow in an app, like signing up or placing an order. It shows how many users reach each step, where they drop off, and how long they take between steps.
How do I track a funnel in my Android, iOS, Flutter, React Native or Kotlin Multiplatform app?
Send a custom event for each step with trackEvent from the Measure SDK, then create a funnel from those events on the Measure dashboard. Measure calculates the funnel from events it has already collected, so the funnel includes existing data as soon as it's created.
What is a conversion window?
The conversion window is how long a user has to get from the first step of a funnel to the last. In Measure, it can be between 1 minute and 30 days. A user who completes the steps after the window has passed doesn't count as converted.
How do I find out why users drop off in a funnel?
Look at what the users who dropped off experienced between the steps, and compare it with the users who converted. Measure's friction view lists the crashes, ANRs, errors, slow traces and slow network requests for each group, sorted by drop-offs, and session replays show what happened in the sessions of users who dropped.