



Debug Android Performance in Production With Trigger-Based Profiling
Android's trigger-based profiling captures Perfetto traces and heap dumps from users' devices when your app hits an ANR, slow start or out-of-memory crash.

Abhay Sood
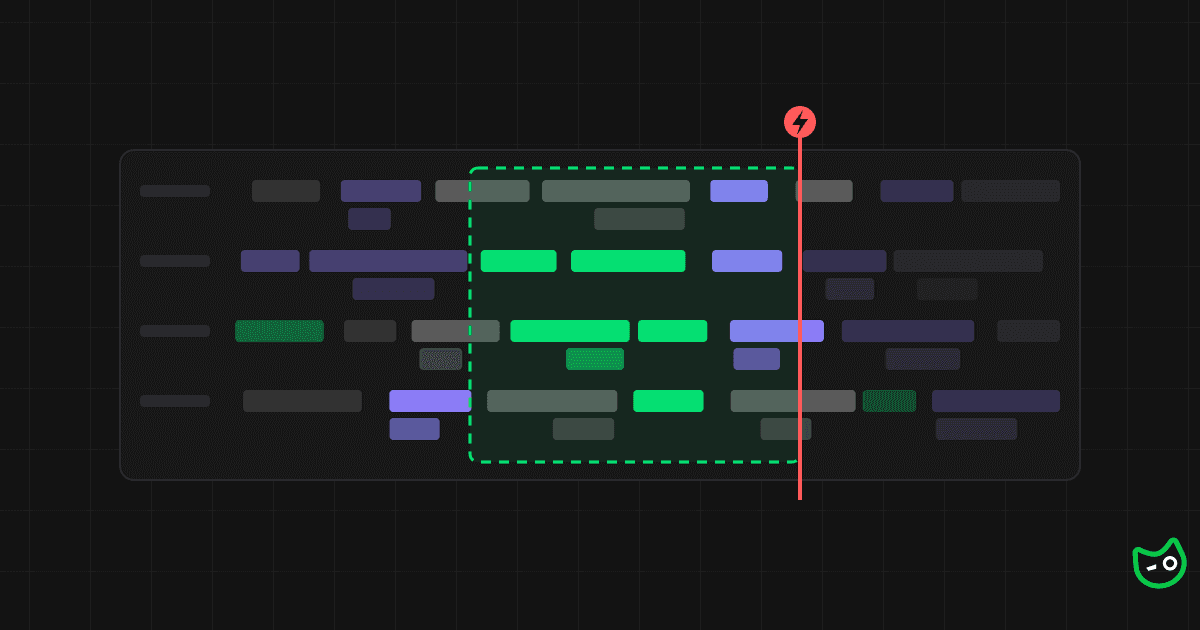
Profiling an Android app usually means plugging in a phone, opening Android Studio's profiler or Perfetto, and trying to make the problem happen while it records. But most performance problems in production are hard to reproduce locally.
Until Android 16, there was no supported way to record a trace on a user's phone. A Perfetto trace could only be started over adb, from a computer connected to the phone.
When an app hits an ANR in production, all we get is a stack trace of the main thread, taken after the app has frozen. By then, the code that blocked the main thread may have already finished, so the stack trace often shows unrelated code. Slow starts have the same problem. We know how long the launch took, but not where the time went. Figuring out what went wrong requires guessing, or adding logs and traces to get more information in the next release.
What is trigger-based profiling on Android?
Android 16 added ProfilingManager, which lets our apps ask the system for a profile. With trigger-based profiling, we tell the system which events we care about, like an ANR or the app finishing its first draw. When one of those events happens, the system captures a profile for us and hands the file back to the app.
From time to time, the system runs a Perfetto trace in the background and keeps only the most recent data. When a trigger fires, it saves a copy of what it has recorded, so the profile includes what happened before the event.
For an ANR, that means we can see what the main thread was doing before it froze.
We can also ask for a profile ourselves with requestProfiling. This gives us more control. We pick the type of profile, like a system trace, a heap dump, a heap profile or stack samples, and we decide when it starts and stops. It's useful when we already suspect a specific flow.
How ProfilingManager works
Android records the profiles for us. Perfetto is the tracing tool built into Android, and a system service decides when to run it. The app uses ProfilingManager to send requests to this service and to receive the files it produces.
For triggers, it works like this:
- Every day or so, the system starts a Perfetto trace in the background and lets it run for a while. The trace is written to a fixed-size buffer in memory, so new data replaces the oldest data and the buffer always holds the last few seconds to minutes.
- When a trigger fires, the system saves a copy of that buffer while the background trace keeps running.
- The system removes data about other apps from the copy and writes it to a file in the app's storage.
- The app receives the file through the callback it registered.
When the app asks for a profile itself with requestProfiling, the system starts a new Perfetto session for it. A heap dump is taken right away. Other profiles record until the app cancels the request or the requested duration ends. The file is then passed to the listener given to requestProfiling.
Available ProfilingTrigger types and what each one captures
To get profiles, we register a callback with ProfilingManager. The system calls it with a file each time it captures a profile for our app.
val profilingManager = context.getSystemService(ProfilingManager::class.java)

profilingManager.registerForAllProfilingResults(Executors.newSingleThreadExecutor()) { result ->
    if (result.errorCode == ProfilingResult.ERROR_NONE) {
        upload(result.resultFilePath)
    }
}
These are the main triggers:
| Trigger | Android version | What we get | Helps answer |
|---|---|---|---|
| Cold start | 16+ (app fully drawn), 17+ (cold start) | System trace, plus stack samples on 17+ | Where did the launch time go? |
| ANR | 16+ | System trace | What was the main thread stuck on? |
| Out of memory | 17+ | Java heap dump | Which objects were using up the memory? |
| Excessive CPU usage | 17+ | System trace | Which threads were using the CPU? |
| App request | 16 QPR2+ | System trace | What happened before the app asked for a trace? |
Cold start
Android 16 has an app fully drawn trigger, which fires when the app calls reportFullyDrawn() during a cold start. The trace covers the launch up to that call, so we can see where the time went, whether that's app initialization, a slow disk or network read, or the main thread waiting on another thread.
Android 17 adds a cold start trigger that doesn't need reportFullyDrawn(). Along with a system trace of the launch, it records stack samples, which are snapshots of the app's call stacks taken many times a second. They show which functions were running even in code that has no trace sections.
ANR
The ANR trigger fires when Android decides the app isn't responding, before it kills the app. The trace shows what the main thread was doing in the time leading up to the ANR, and what it was waiting on, like a lock held by another thread, a slow binder call or a busy CPU. An ANR stack trace alone can't show this.
Available on Android 16 and above.
Out of memory
The out-of-memory trigger fires when the app crashes with an OutOfMemoryError. Instead of a trace, it gives a Java heap dump. This lists every object on the Java heap at the time of the crash, how much memory each one takes, and which objects hold references to which. That makes it possible to see what was filling the heap and what was keeping it from being freed. It only works if Android's default crash handler runs. If the app or a library sets its own handler, that handler has to call the default one.
Available on Android 17 and above.
Excessive CPU usage
This trigger fires when Android kills the app for using too much CPU. The system trace shows which of the app's threads were running on the CPU, and for how long, before the app was killed.
Available on Android 17 and above.
App request
The other triggers fire on events the system detects. With this one, the app decides when to take a profile. Once the trigger is registered, the app can call requestRunningSystemTrace() when it notices a problem the system doesn't track, like a screen that took too long to load. The system saves the background trace the same way it does for an ANR, so the profile shows what happened just before the call.
Available on Android 16 QPR2 (API level 36.1) and above.
Adding custom trace sections
Apps can add their own sections to a trace with the AndroidX tracing library. Most teams only use them when profiling locally. With trigger-based profiling, these sections are also part of the traces that come back from production.
This means the sections we already use locally also show how long our code takes on users' devices. We also see what else was happening at the time, like what other threads were doing.
To add a section, wrap the code in trace:
import androidx.tracing.trace

class MainApplication : Application() {
    override fun onCreate() {
        super.onCreate()
        trace("ReactNative.init") {
            SoLoader.init(this, OpenSourceMergedSoMapping)
        }
    }
}
Here's how ReactNative.init shows up in a cold start trace, inside bindApplication on the main thread.

Without this section, React Native's setup would be hidden inside bindApplication. With it, we can see it takes 144 ms, most of which is spent loading native libraries.
How production traces help
Here's a real trace of a common bug. A cache class uses one lock for both saving and loading. Saving happens on a background thread and writes the whole cache to disk. Loading happens on the main thread when the user taps a button.
class ProfileCache(private val file: File) {
    private val lock = Any()

    // Called on a background thread named "profile-cache"
    fun save(profile: Profile) = trace("ProfileCache.save") {
        synchronized(lock) { file.writeBytes(profile.toBytes()) }
    }

    // Called on the main thread, when the user taps "Profile"
    fun load(): Profile = trace("ProfileCache.load") {
        synchronized(lock) { Profile.fromBytes(file.readBytes()) }
    }
}
If the user taps while a save is still writing to disk, load() has to wait for the lock, and the app freezes. Here's a trace where that froze the app for almost 4 seconds.

- On the main thread,
ProfileCache.loadtakes 3.7 seconds, and the app can't respond to the user during that time. - Under it is a
monitor contentionslice. Android adds this slice when a thread has to wait for a lock. Its name includes the thread holding the lock, which here isprofile-cache. - On the
profile-cachethread,ProfileCache.saveis writing to disk for the same 3.7 seconds. It holds the lock the whole time, so the main thread can only continue once the save is done.
If this freeze happened on a user's phone, a profile would show us all of this, and we wouldn't need to reproduce it ourselves to find the cause.
Limits of trigger-based profiling
Not every trigger produces a profile:
- The background trace isn't always running. By default, it runs for about 30 minutes once every 18 to 30 hours. An ANR outside that window doesn't produce a profile.
- There's a limit on how many profiles the system takes. Each app has hourly, daily and weekly limits, and the whole device has its own limits too. After a limit is hit, triggers don't produce profiles until enough time has passed.
So we only get profiles for some of these events. With enough users, that's still plenty to find the common problems.
A few more things to keep in mind in production:
- It needs Android 16 or above. For now, that's a small share of most apps' users.
- Profiles can arrive late. After an ANR, the app is often killed before it receives the result, so the profile arrives on a later launch.
- Profiles are big, often over 10 MB. It's best to upload them in the background, separately from the rest of the app's data.
Trigger-based profiling in Measure
Measure registers the cold start, ANR, out-of-memory and excessive CPU usage triggers on devices running Android 16 and above. Profiles are uploaded in the background using WorkManager. See the profiling docs for setup.
Every profile shows up on the Profiles page, where you can filter by trigger, app version or device. Each profile opens in Perfetto with one click, without downloading the file first.
You can also download a profile and have a coding agent read it. Google publishes a Perfetto trace analysis skill for agents like Claude Code, and the Perfetto team has its own skill too. In this video, Claude Code uses the Android skill to find what caused the freeze we looked at earlier.
FAQ
What is ProfilingManager in Android?
ProfilingManager is an Android API, added in Android 16, that lets apps get profiles like Perfetto traces and heap dumps from the system. Apps can ask for a profile directly, or register triggers like ANRs and cold starts so the system captures one when that event happens.
Which Android versions support trigger-based profiling?
Trigger-based profiling needs Android 16 (API level 36) or above. The app fully drawn and ANR triggers work on Android 16. The app request trigger needs Android 16 QPR2 (API level 36.1), and the cold start, out-of-memory and excessive CPU usage triggers need Android 17.
How do I get a Perfetto trace for an ANR from a user's device?
Register the ANR trigger with ProfilingManager, along with a callback for the results. If the system's background trace is running when an ANR happens, it saves a trace and passes the file to the callback, often on the app's next launch. From there, the app needs to upload the file so it can be opened in Perfetto.
How do I add custom trace sections to an Android app?
Use the AndroidX tracing library. Wrap the code you want to measure in trace("name") { ... }, and it shows up as a named section in Perfetto, including in profiles captured from production.