Performance Impact
Benchmarks for the Measure SDK's impact on app startup and per-event overhead, plus comparison to Firebase initialization.
See the platform-specific sections below for details on the performance impact of the Measure SDK on your app.
Android
Benchmarks
We benchmark the SDK's performance impact using a Pixel 4a running Android 13 (API 33). Each test runs 35 times using macro-benchmark. For detailed methodology, see android/measure-android/benchmarks.
Benchmark results are specific to the device and the app. It is recommended to run the benchmarks for your app to get results specific to your app. These numbers are published to provide a reference point and are used internally to detect any performance regressions.
Benchmarks results for v0.16.0:
- Adds 17.5ms-31.3ms (24.3ms median) to the app startup time (Time to Initial Display) for a simple app.
- Adds 0.6-1ms to detect and create a layout snapshot for click gestures.
Profiling
To measure the SDK's impact on your app, we've added traces to key areas of the code. These traces help you track performance using Macro Benchmark or by using Perfetto directly.
Here's the table:
| Metric | Description |
|---|---|
msr-init | Time spent on the main thread while initializing |
msr-start | Time spent on the main thread when Measure.start is called |
msr-stop | Time spent on the main thread when Measure.stop is called |
msr-trackEvent | Time spent in storing an event to local storage. Almost all of this time is spent off the main thread |
msr-trackGesture | Time spent on the main thread to track a gesture |
msr-generateSvgAttachment | Time spent on background thread to generate an SVG layout |
msr-captureScreenshot | Time spent on main thread to capture and compress a screenshot |
msr-loadImageFromFile | Time spent on main thread to load an image from a file |
msr-loadImageFromUri | Time spent on main thread to load an image from a Uri |
Comparison to Firebase initialization
The following are the results from running a macro-benchmark test to compare initialization
time of Measure SDK vs Firebase. Tested with firebase BOM version 33.7.0 and
Measure Android SDK version 0.10.0 running on a Pixel 4a.
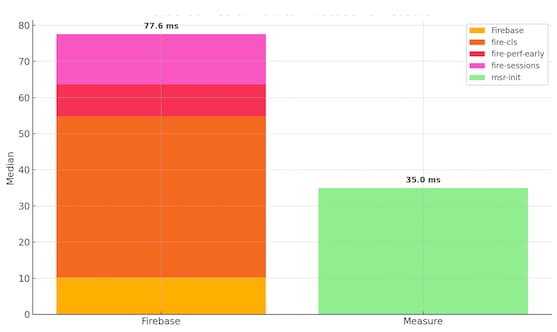
Firebase initializes in multiple phases. The total median time to initialize when running the
benchmark for an app with Firebase crashlytics, performance and analytics SDK
was observed as 77.6ms. While Measure took 35.0ms in the same macro-benchmark test.
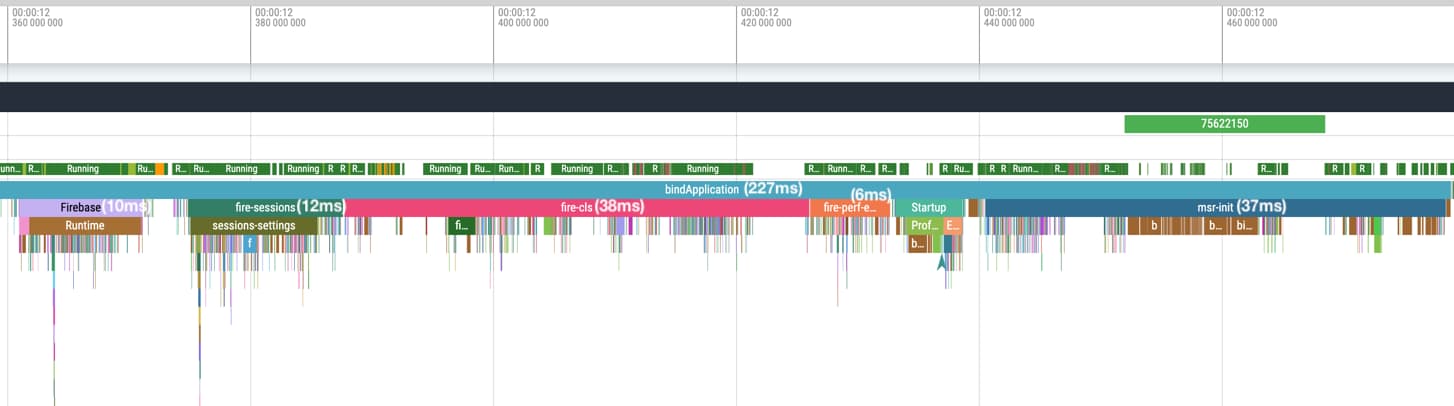
Perfetto screenshot from one of the runs:
iOS
Benchmarks
We benchmarked the iOS SDKs performance impact using a baseline app on an iPhone 14 Plus
running iOS 18.5. Each scenario was executed 5 times and instrumented with os_signpost for
precise time tracking. Metrics were collected via Instruments (Time Profiler and Logging with
Signposts).
Performance impact varies based on device and application complexity. We recommend measuring impact in your specific app. The following numbers serve as a reference baseline and are used internally to monitor regressions.
Benchmark Results (v0.6.0)
Measure adds 21.03–25.7 ms (avg ~22.8 ms) to app startup time (Time to Initial Display). Other key operations performed by the SDK can be found below:
| Operation | p95 | Description |
|---|---|---|
trackEvent | 195 µs | Includes event collection, attribute enrichment and queueing |
appendAttributes | 360 µs | Dynamic attribute gathering (e.g., network, device state) |
trackBugReport | 120 µs | Complete flow including screenshot, layout and metadata |
trackEventUserTriggered | 32 µs | User-triggered event tracking |
trackSpanTriggered | 96 µs | When a trace event is emitted |
spanProcessorOnStart | 105 µs | Span construction |
spanProcessorOnEnded | 355 µs | Span serialization and buffering |
generateScreenshot | 80 ms | Snapshotting and compression of UI |
generateLayoutSnapshot | 7.5 ms | Layout hierarchy capture |
Think this page can be better?
Open an issue