


Why Android and iOS apps crash: the complete causes and fixes reference
A reference to every way a mobile app can crash, grouped by what terminated the process. It covers the exit codes to read on Android and iOS and the fix for each type.

Abhay Sood
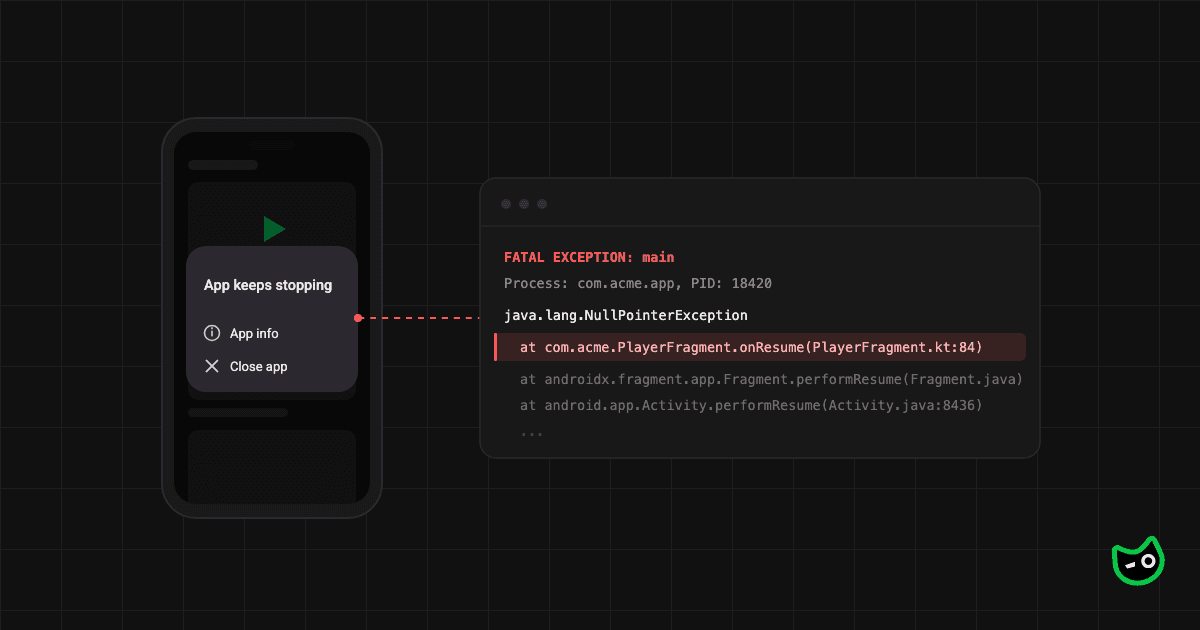
If you search for common reasons apps crash on Android and iOS, you will find the same list every time: memory leaks, unhandled exceptions, network failures and device fragmentation. Each of these can crash an app, but the list is hard to act on. When your app keeps crashing in production, you cannot open a crash dashboard and search for "device fragmentation".
A better place to start is how the app stopped. Sometimes a bug in your code crashes the app, for example, when it tries to use data that is not there. Sometimes the system kills the app because the device is low on memory or because the app froze for too long. Android and iOS both record why your app stopped. There are six ways in all. Each one has its own fix.
This guide explains why apps crash on Android and iOS by walking through all six. For each one, we cover what causes it, how to recognise it and how to fix it.
If you use apps rather than build them
If you landed here because an app keeps crashing on your phone, this section is for you. The rest of this guide is written for the people who build apps.
When an app crashes on Android or iPhone, it's usually for one of four reasons. The app is out of date. The phone is low on storage. Too many apps are open and the phone is running out of memory. Or the current version of the app has a bug on your phone model.
Try these steps in order: update the app, restart your phone, free up storage, then reinstall the app. If the crashes started right after an app update, the bug is in the app. Report it through the App Store or Google Play listing. Include your phone model and your Android or iOS version so the developer can find the problem.
If several Android apps crash, or several apps crash on your iPhone, the problem is more likely the phone than any one app. Install any available system update. If that does not help, contact the phone maker's support.
What counts as a crash?
In this guide, a crash is any time your app's process ends when neither the app nor the user chose to close it. Many crash reporting tools use a narrower definition. They only count the crashes they can record with a stack trace.
Under the wider definition, all of these are crashes:
- An uncaught exception in Kotlin, Java or Objective-C, or a runtime trap in Swift.
- A segmentation fault (
SIGSEGV) in a native library. - The system killing your process to reclaim memory.
- A watchdog terminating your app because it blocked the main thread for too long.
Memory kills produce no stack trace. The process just ends. Watchdog and ANR terminations do record thread stacks, but not every crash reporter collects them. So memory kills and watchdog terminations often leave nothing in your crash reporter.
This is why your users can say the app keeps closing while your crash dashboard looks fine. An Android application crash that your tool never recorded is still a crash to the person using the app.
The six types of app crashes
There are six ways a mobile app can crash. The table shows what causes each one, whether a crash reporting tool can record it and where to start fixing it.
| Crash type | What causes it | Can a crash reporting tool record it? | Where to start fixing it |
|---|---|---|---|
| Unhandled exception | An uncaught exception in Kotlin, Java or Objective-C, or a runtime trap in Swift | Yes, with a full stack trace | Read the stack trace, then check which data or lifecycle assumption failed |
| Native crash | A fatal signal such as SIGSEGV or SIGABRT from C or C++ code | Yes, if the tool installs a native crash handler and you upload symbols | Symbolicate the crash and check recently updated native dependencies |
| Memory termination | The device ran low on memory and the system killed your process to reclaim it | Usually not directly. Some tools read the exit reason from the system on the next launch | Reduce your memory footprint, starting with images and caches |
| Watchdog or ANR termination | The main thread was blocked for too long | Partly. It depends on the tool and the OS version | Move slow work such as disk, network and database calls off the main thread |
| Background termination | The app broke a rule about what it may do while suspended or in the background | Usually not. It needs the platform exit APIs | Release file locks and database connections before the app is suspended. Use the platform APIs for background work |
| Startup crash before the SDK initialises | Any of the above, before your crash reporting SDK has started | No | Initialise crash reporting early. Use staged rollouts. Watch Play Console and the Xcode Organizer |
Startup crashes are the hardest of the six to spot. If your app crashes before the crash reporting SDK initialises, the SDK cannot record it. A release with a startup crash can then look like a sudden drop in daily active users rather than a spike in crashes.
Google says that Android vitals include crashes that happen before an SDK initialises. When daily active users fall and your crash dashboard looks normal, check Play Console before you check your code. On iOS, the Xcode Organizer shows these crashes for users who share diagnostics with developers.
Finding out why your app crashed on Android
Since Android 11, the system records why each of your app's recent processes ended. Your app can read it. ActivityManager.getHistoricalProcessExitReasons() returns a list of ApplicationExitInfo objects. Each one has a reason code and the process importance at the time it ended. ANRs also include a trace. Native crashes do too on Android 12 and later.
The reason code tells you which kind of crash it was:
| Reason | What it means | Where to look next |
|---|---|---|
REASON_CRASH | An uncaught exception in Java or Kotlin code | Your crash reporting tool should already have this one, with a stack trace |
REASON_CRASH_NATIVE | A fatal signal from native code | The tombstone and native symbols. Check native dependencies you updated recently |
REASON_ANR | The app stopped responding | The ANR trace and the description, which names the component that timed out |
REASON_LOW_MEMORY | The low memory killer ended your process | A memory profile and retained bitmaps, not the code that was running at the time |
REASON_EXCESSIVE_RESOURCE_USAGE | The system decided your app used too much of a resource, such as CPU in the background | Background work, wake locks and long-running CPU work |
REASON_SIGNALED | The process received a fatal signal from outside the app | Often the system or the user. Check the process importance when it ended |
REASON_DEPENDENCY_DIED | A process your app depended on ended first | The dependency, not your app |
REASON_USER_REQUESTED | The user force-stopped the app | Not a bug, but worth counting |
On some devices, low memory kills show up as REASON_SIGNALED instead of REASON_LOW_MEMORY. Call ActivityManager.isLowMemoryKillReportSupported() to check whether the device reports them correctly.
Read the exit reasons on the next launch and report them alongside your crash data. Then your crash dashboard shows most of the crashes your users experience. It takes very little code. It is also the fastest way to tell whether your missing crashes are memory kills, background terminations or something else.
Finding out why your app crashed on iOS
On iOS, you can find out why your app stopped in two places: crash reports and MetricKit. Every crash report has an Exception Type. When the system ended the process rather than your code, the report also has a Termination Reason. MetricKit delivers crash and hang diagnostics to your app in code. From iOS 15, those diagnostics arrive on the next launch instead of in a daily batch.
These exception types and termination codes cover the most common iOS app crash causes:
| Code or type | What it means | Usual cause |
|---|---|---|
EXC_BAD_ACCESS (SIGSEGV or SIGBUS) | Invalid memory access | A dangling pointer, an over-released object or a bug in a native dependency |
EXC_BREAKPOINT (SIGTRAP) | A Swift runtime trap | Force unwrapping nil, a failed force cast with as!, or an array index out of range |
EXC_CRASH (SIGABRT) | The process aborted itself | An uncaught Objective-C exception, or code that called abort() |
0x8badf00d ("ate bad food") | The watchdog terminated the app | The main thread was blocked for too long during launch, resume or another lifecycle event |
0xdead10cc ("deadlock") | The app held a system resource while suspended | A file lock or SQLite connection kept open across suspension, often in a background task |
EXC_RESOURCE | The app went over a resource limit, such as CPU, memory, or disk writes | Sustained heavy work. Not every EXC_RESOURCE report means the app was killed |
| Jetsam event | The system killed the app to free memory | A memory footprint too large for the device, often images or caches. Jetsam kills produce a JetsamEvent report, not a crash report |
The Xcode Organizer reports crashes, hangs, launch time, memory, disk writes and terminations from users who share analytics with developers. Watch the hang rate closely. Many crash reporting tools don't report hangs. A hang becomes a crash only if the watchdog ends the app. Measure reports app hangs with the main-thread stack and whether the app recovered or was killed.
Cause 1: unhandled exceptions
Unhandled exceptions are the most common type of crash and the easiest to understand. On Android, these include exceptions such as NullPointerException, IllegalStateException, ClassCastException and IndexOutOfBoundsException. On iOS, the Swift equivalents are force unwrapping a nil optional, force casting with as! and array index out of range. These are runtime traps rather than exceptions, so you can't catch them.
In production, most of these crashes are not logic errors. They happen when an assumption about data holds during development but fails for real users. One common example is an API field that is sometimes missing but is not optional in your model. Another is a cached object read after the screen that owned it was destroyed. Another is a configuration value that does not exist yet on first launch. Kotlin and Swift both remove the simple null dereference. So the exceptions that reach production are usually about lifecycle and deserialisation.
To fix and prevent them:
- Model API responses on what the server actually sends, not on what the documentation says. Make a field optional if it can ever be missing.
- Treat any value that crosses a lifecycle or process boundary as missing until you check it. This includes saved state, intent extras and data restored after process death.
- Avoid non-null assertions (
!!) in Kotlin and force unwrapping oras!in Swift outside code you fully control. Use?.,guard letandas?instead. - On Android, collect UI state with lifecycle-aware APIs such as
repeatOnLifecycleso background work doesn't touch a view after it is destroyed. - When you read the stack trace, start from the first frame in your own code. The frames above it usually belong to the framework.
Cause 2: native crashes, including the 16 KB page size change
If your app ships native code, it can crash in ways the managed runtime cannot catch. On Android, native code means any .so file, whether you wrote it or an SDK brought it. On iOS, it means C or C++ code, including code inside third-party frameworks.
These crashes arrive as fatal signals, most often SIGSEGV or SIGABRT. The raw stack trace is a list of memory addresses. You need a native crash handler and uploaded symbols before you can read it.
To fix native crashes:
- Upload symbols for every release. On Android, set
ndk.debugSymbolLevelso the native debug symbols go into your app bundle and Play Console can symbolicate the crashes. On iOS, upload the dSYM files for each build. - Check which native dependencies changed in the release. The crashing library is often an SDK you did not write.
- Reproduce memory bugs with AddressSanitizer or HWASan in a test build. They catch use-after-free and buffer overflow bugs where they happen, instead of where the app crashes later.
Android's move to 16 KB memory pages is a recent cause of native crashes that is easy to miss. Android has historically used 4 KB memory pages. From Android 15, AOSP supports devices configured with 16 KB pages. Since 1 November 2025, new apps and updates that target Android 15 or above must support 16 KB page sizes on 64-bit devices to be accepted by Google Play.
On a 16 KB device, a native library that is not 16 KB aligned may fail to load. The app then fails to start or crashes right after launch, often with an UnsatisfiedLinkError rather than a native signal.
Two things make this hard to diagnose. First, apps written entirely in Kotlin or Java are not affected. So teams often assume they are safe without checking whether a dependency ships native code. Second, the library that fails to load is usually not yours.
To fix it:
- Check your app for unaligned .so files. The APK Analyzer in Android Studio flags libraries that are not 16 KB aligned. That is faster than reading a stack trace.
- Rebuild with NDK r28 or later and Android Gradle Plugin 8.5.1 or later. These versions align native libraries to 16 KB by default.
- Update any SDK that ships prebuilt .so files to a version that supports 16 KB pages.
- Replace any hardcoded assumption that a page is 4 KB with a call to
getpagesize(). - Test on the 16 KB Android emulator system image before you release.
Cause 3: memory terminations
Both platforms kill processes under memory pressure. Neither treats it as an error in your app. On Android, the low memory killer chooses a process based on its importance and memory footprint. On iOS, Jetsam does the same job. There is no exception, no signal you can usefully catch and no stack trace worth reading. The code running when the process dies is rarely the code that used the memory.
Your users notice this type of crash, but it is the one most likely to be missing from your dashboard. It usually shows up as the app restarting from scratch when the user returns from the background.
Android now measures memory directly. Memory usage (anonymous RSS plus swap) and bitmap memory usage are core vitals in Android vitals. Memory usage thresholds depend on the device RAM tier and the app state. Bitmap memory thresholds are 200 MB for user-perceived services and background states. For cached apps, they are 400 MB. These thresholds are the same on every RAM tier. Google says apps that exceed these thresholds may become less visible on Google Play starting from February 2027. Images are often the biggest part of an app's memory. They are a good place to start. We cover these thresholds and how to measure dynamic memory in production in Understanding memory usage of Android apps in production.
To fix memory terminations:
- Decode images at the size they are displayed, not at their source size. Image libraries such as Coil and Glide do this when they know the target size.
- Release caches in
onTrimMemory()on Android and when your app receives a memory warning on iOS. - Look for leaked Activity, Fragment and view controller references. Leaks are the usual way an app grows large enough to be killed. LeakCanary on Android and the Xcode memory graph debugger on iOS find them.
- Profile memory on a low-end device with the Android Studio Memory Profiler or Xcode Instruments, not only on your own phone.
- Count memory kills in production. On Android, read
REASON_LOW_MEMORYexits on the next launch. On iOS, MetricKit reports memory limit exits inMXAppExitMetric.
Cause 4: watchdog and ANR terminations
When the main thread stops responding, both platforms eventually end the app. On Android, this is an ANR (Application Not Responding). The system raises it against a specific component. Each component type has its own timeout. The most common is an input event that isn't handled within 5 seconds. On iOS, the watchdog terminates the app with 0x8badf00d when it takes too long to respond to a lifecycle event such as launch or a scene update.
ANRs and watchdog terminations have the same cause. Work that belongs on a background thread is running on the main thread, or the main thread is waiting on a lock held by something slow. On iOS, hangs shorter than the watchdog limit never end the app at all. They make the app feel broken. They show up in reviews instead of dashboards. This is why Apple shows hang rate in the Xcode Organizer and hang diagnostics in MetricKit.
To fix watchdog and ANR terminations:
- Move disk, network and database work off the main thread. On Android, use coroutines with
Dispatchers.IO. On iOS, use Swift concurrency or a backgroundDispatchQueue. - Turn on StrictMode in Android debug builds. It flags disk and network access on the main thread while you develop.
- Keep startup work short. Defer SDK initialisation and anything the first screen does not need.
- Look for lock contention. A main thread waiting on a lock held by a background thread shows up as blocked in the ANR thread dump.
- Read the main thread stack in the ANR trace or the
0x8badf00dcrash report. The trace is taken when the timeout fires, so the slow work may have finished just before it. Look at several traces for the same issue before you decide on the cause.
Android ANRs have more detail than fits here. Our guide to diagnosing ANRs in production covers timeouts, the triage path and common traps.
Cause 5: lifecycle and background terminations
Both platforms limit what an app can do once the user is no longer looking at it. Both end the process when an app breaks those rules. The iOS code 0xdead10cc is the clearest example. It fires when an app holds a system resource, such as a file lock or an open SQLite connection, while it is suspended. On Android, the equivalents show up as exit reasons like REASON_EXCESSIVE_RESOURCE_USAGE and as background execution limits that stop work you assumed was still running.
These crashes rarely happen in development. An app running in the foreground under a debugger never reaches the states that trigger them. To test them, put the app in the background, let the device sit idle and then return to it. Manual QA usually skips this sequence.
To fix lifecycle and background terminations:
- On iOS, finish or cancel file and database work before the app is suspended. Wrap work that must finish in
beginBackgroundTask(withName:expirationHandler:). End the task when the work is done or the expiration handler runs. - If your SQLite database or other files live in a shared App Group container, release their locks before the app is suspended. This is the most common source of
0xdead10cc. - On Android, use WorkManager for deferrable background work and a foreground service for work the user should know about. Do not rely on a plain background thread to keep running.
- For apps targeting Android 12 and later, you can't start foreground services from the background in most cases. Trying anyway throws
ForegroundServiceStartNotAllowedException. - Hold wake locks only as long as you need them. Long partial wake locks count towards the excessive partial wake locks core vital.
Cause 6: startup crashes and everything your SDK cannot see
Your crash monitoring cannot see a crash that happens before it initialises. It also cannot see a crash in its own initialisation. A release with this kind of crash can reach many users before anyone notices. The crash dashboard shows nothing.
To catch and fix startup crashes:
- Initialise crash reporting as early as is safe, before other SDKs and before your own startup work.
- Use staged rollouts on Google Play and phased releases on the App Store, so a startup crash reaches a small share of users first.
- Check Android vitals in Play Console and the Xcode Organizer after every release. Both include crashes that happen before any SDK starts.
- Test a release build both as a clean install and as an upgrade from the previous version. Startup crashes often come from migrations and stale data that only exist after an upgrade.
- Treat a sudden drop in daily active users as a stability problem until you can rule that out.
Common root causes behind these crashes
The six types above describe how an app stops. The root cause is often one of the problems below. Each can lead to more than one type of crash.
- Device and OEM differences. Some Android manufacturers modify the platform, kill background apps more aggressively or ship buggy drivers. A crash that only appears on one brand or model is usually one of these. Filter your crashes by device model and test on the affected device.
- WebView. On Android, Google Play updates WebView separately from your app. When many apps are crashing on Android at the same time, a bad WebView update is a common cause. Override
onRenderProcessGone()so a WebView renderer crash does not take down your whole app. - Third-party SDKs. Ads, analytics and payment SDKs run code inside your process. Their crashes are your crashes. Pin SDK versions and read their release notes. Ship SDK updates in a staged rollout.
- Remote config and feature flags. A config or flag change can crash an app without a new release. Validate remote values and give every flag a safe default. Make sure you can roll a flag back quickly.
- Database migrations. A migration that fails on upgrade crashes the app on every launch until the user reinstalls. Test migrations from every app version that is still in use, not only the previous one.
- Server changes. A server that starts returning a new error format or an empty field can crash the client. Parse responses defensively. Test the app against malformed responses.
- OS updates. A new Android or iOS version can change behaviour your app relies on. Test on the beta versions of each OS before they reach your users.
Why your crash-free rate does not match Play Console
Play Console and your crash reporting tool often show different crash rates for the same app. In most cases, both numbers are correct. The two tools count crashes in different ways. They also divide them by a different total.
Google's documentation explains where these differences come from. Android vitals includes events SDKs don't see, such as crashes before SDK initialisation and ANRs before Android 12. It only counts certified devices, apps installed from Google Play and users who agreed to share data. The biggest difference is the denominator. Android vitals reports issues per daily active user, while Crashlytics counts issues per session. In Google's example, a user who opens an app three times in one day and has one crash gives a 100% crash rate in Android vitals and a 33% crash rate in Crashlytics.
This means a crash-free session rate of 99.5% and a per-user crash rate of 1.5% can both describe the same app. Google's thresholds use the per-user rate, so that is the number to compare against them.
Google Play crash rate thresholds
Google Play publishes explicit thresholds. User-perceived crash rate is a core vital, which means it affects how visible your app is on Google Play. The bad-behaviour thresholds are 1.09% of daily active users across all device models and 8% of daily active users on any single phone model. If you exceed either one, Play may reduce your app's visibility and show a warning on your store listing. User-perceived ANR rate is also a core vital, with thresholds of 0.47% overall and 8% per phone model.
Play assesses your app on a 28-day average. Android vitals flags crashes and ANRs that have affected devices for more than 7 days as emerging issues. Google says this gives you 21 days to fix them.
Teams often miss the per-device threshold. An app well under 1.09% overall can still be failing badly on one popular phone model. The overall number will not show it. Check the per-model breakdown in Android vitals after every release.
Apple publishes no equivalent threshold. Most teams set their own target and track it per release in the Xcode Organizer.
Building a workflow around this
The exit reason on Android, or the termination code on iOS, tells you which of the six types a crash belongs to. Each type needs a different starting point. For an unhandled exception or a native crash, start with the stack trace. For a memory termination, start with a memory profile. For a watchdog or background termination, you need the sequence of events that led up to it.
What's usually missing is what the app and the user were doing before the process died. For exception crashes, the stack trace often makes that clear. For memory kills, watchdog terminations and background terminations, it doesn't. The evidence is a sequence of events rather than a single moment.
Measure attaches a session replay of the 5 minutes before every crash and ANR. The one below is from Measure's sandbox. It shows a NullPointerException in CheckoutViewModel.onPlaceOrderClicked(), thrown when the app called Cart.getId() on a null cart.
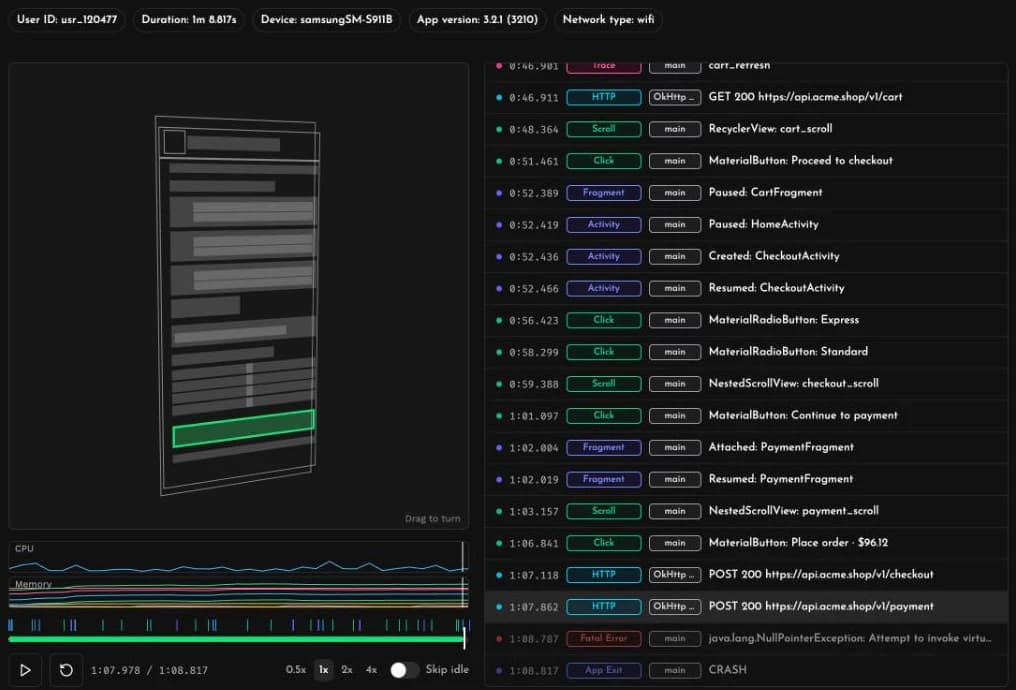
The stack trace tells you which line failed. The replay shows how the app got there. The user loaded their cart in CartFragment, inside HomeActivity. They tapped "Proceed to checkout", which opened a new CheckoutActivity. They picked a delivery option and moved on to payment. Then they tapped "Place order". Both the checkout and payment requests returned 200. Less than a second later, the app crashed while reading the cart.
That sequence narrows down the cause. The cart was loaded in one activity. The order was placed from another one that no longer had it. It also shows the impact. The payment went through before the crash, so the user was probably charged without ever seeing a confirmation.
You can open this session and others in the interactive demo. Measure is open source under Apache 2.0 and can be self-hosted.
FAQs
Why do apps crash?
Apps crash when their process ends without the app or the user closing it. The most common reasons are unhandled exceptions, native crashes, memory terminations, watchdog and ANR terminations, background terminations and startup crashes. Each one has a different fix. The sections above cover all six.
Why do apps crash on Android but not iOS, or the other way round?
Usually the crash is in platform-specific code rather than shared logic, or the platforms enforce different limits. Memory limits, background execution rules and watchdog timeouts all differ. So the same inefficient code can survive on one platform and be terminated on the other. Native dependencies are another common source. They are often different libraries on each platform even when the app looks the same.
Can a crash reporting tool catch every crash?
No. Nothing running inside your process can report a crash that happens before it starts. Memory kills and background terminations produce no exception or signal that the app can catch. Tools that read the platform exit APIs can report these on the next launch.
What is the acceptable crash rate for a mobile app?
For Android, Google publishes an answer. Keep the user-perceived crash rate below 1.09% of daily active users overall and below 8% on any single phone model, or Play may reduce your app's visibility. Apple publishes no equivalent threshold, so teams usually set an internal target and track it per release. Check which denominator your tool uses before you compare it against a published figure. Per-session and per-user rates are not the same.
Why did my app start crashing after an OS update without a code change?
The platform changed a rule your app relied on. Behaviour changes that apply to all apps on a new OS version, tighter background restrictions and stricter memory or resource limits can all do this. The 16 KB page size change on Android 15 is a current example. Native libraries that worked for years can fail to load on devices configured with 16 KB pages.
Sources
- Android vitals, Android Developers
- Crashes, Android Developers (Android vitals)
- Diagnose and fix ANRs, Android Developers
- Support 16 KB page sizes, Android Developers
- Track down hangs with Xcode and on-device detection, Apple Developer (WWDC22)
- Meet the new MetricKit, Apple Developer (WWDC26)