



Understanding memory usage of Android apps in production
Understand Google Play’s new dynamic memory thresholds and learn how to measure, monitor, and debug Android app memory usage in production.

Abhay Sood
Your Android app uses 1 GB of memory. Is that a lot?
Before answering, we need another question: 1 GB of what? Java heap? Native memory? RAM? Each of these measures something different, so we need to first understand what they actually mean. We'll then look at what the new Google Play memory thresholds use and how you can monitor and diagnose memory usage of your app using Measure.
Imagine using an image gallery app as an example and see how its memory usage changes as someone browses photos, switches to another app or uploads a new photo in background.
Java heap and native memory
When someone opens the app, it creates Java and Kotlin objects for the screen’s UI, the list of photos and state such as the selected album. These objects live on the Java heap, which Android Runtime manages through garbage collection.
To see how much of the heap is in use and how much it can grow, we look at its total, free, and max memory:
| Reading | Meaning |
|---|---|
| Total | The heap memory currently available to your app’s process, including used and free space. |
| Free | The unused space from the current capacity. |
| Max | The maximum heap size the runtime will attempt to use. |
For example, a total heap of 128 MB with 48 MB free has 80 MB in use and room for more objects. If max is 256 MB, the total heap can grow to that size if needed. This max limit applies only to the Java heap, so the app’s overall memory usage can be higher.
The native heap holds allocations made by native code, including the Android libraries your app calls. Those libraries use native memory even if you haven’t written any C++. For example, on Android 8.0 and later, a bitmap’s pixel data lives in native memory, while the Java object representing it lives on the managed heap.
Measuring your app’s RAM usage
The gallery is now displaying a screenful of photos. Its Java and Kotlin objects live on the Java heap, while the bitmap pixel data lives on the native heap. But how much of the phone’s RAM is the app using?
Alongside those objects and image buffers, the app needs memory for the code it runs, the libraries it loads, and its thread stacks. To account for all of this, we need to look at RAM usage across the entire process.
Memory currently in RAM
RSS, or Resident Set Size, is the amount of physical RAM currently used by your app’s process. Android measures this in blocks called pages, adding up the size of every page currently in RAM for that process.
As the user scrolls through the gallery and more image buffers occupy RAM, those pages contribute to RSS alongside the rest of the process. RSS measures memory across the process, including memory outside the heaps.
Memory shared with other apps
The gallery app can decode a photo using BitmapFactory, which calls into Skia, a graphics library included with Android. A messaging app can use the same library to decode an attachment. Android can share the library’s read-only code pages between the two processes. RSS counts those shared pages in full for each app, even though they occupy RAM only once.
PSS, or Proportional Set Size, counts private pages in full but divides shared pages among the processes using them. RSS and PSS describe the same physical memory using different accounting rules.
Suppose your process has 90 MB of private resident memory and shares another 30 MB with two other processes:
| Measurement | Calculation | Result |
|---|---|---|
| RSS | 90 MB + all 30 MB shared | 120 MB |
| PSS | 90 MB + one-third of 30 MB shared | 100 MB |
PSS is useful for dividing the cost of shared RAM, but its value can change when other processes start or stop sharing those pages. Both RSS and PSS describe resident memory at a particular moment.
Memory moved into swap
You leave the gallery app to open the camera. Android may free up some of the RAM used by the gallery while keeping its process alive.
For example, it can reclaim RAM occupied by Skia’s image-decoding code. That code was loaded from files on the phone into file-backed pages. As long as a page hasn’t been modified, Android can discard it because the original file still holds the same contents. It can reload the page when the app needs that code again.
The objects tracking your selected album and scroll position are different. They were created while you used the app and live in anonymous memory, along with other heap allocations and thread stacks. There’s no file containing a copy of those pages, so Android needs to preserve their contents.
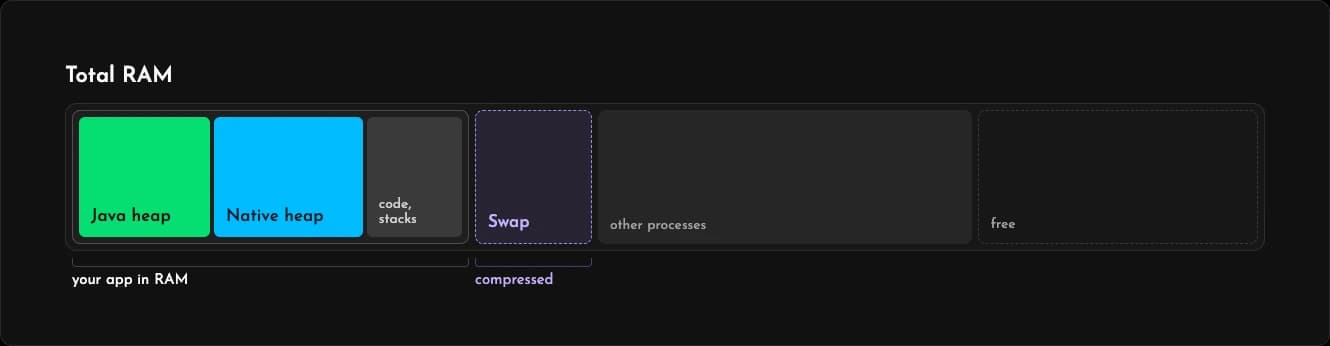
To keep those contents while using less RAM, Android can move the pages into swap. This usually means compressing them in zRAM, a compressed area of the phone’s RAM. These pages now count as swap and no longer contribute to the gallery app’s RSS.
So the gallery app’s RSS can fall even though it still holds the same objects and image buffers.
Dynamic memory
If we’re comparing gallery releases, we want to know whether our changes reduced the memory held by the app. But RSS can fall because Android has discarded code pages or moved memory into swap, even though the app still holds the same objects and image buffers.
Dynamic memory focuses on anonymous memory, such as heaps and stacks, and includes the portion moved into swap. It combines two readings:
- Anonymous RSS counts anonymous pages currently resident in the app’s process.
- Swap counts anonymous pages that Android has moved into swap.
Dynamic memory = anonymous RSS + swap
File-backed pages are excluded, so discarding library code doesn’t reduce this number. Adding swap also prevents compression from looking like the app freed its allocations. This is why Android vitals uses dynamic memory to track app memory usage.
For example, suppose the gallery holds 200 MB of anonymous memory in RAM before the camera opens. If Android moves 60 MB into swap, the readings change like this:
| Reading | Before | After |
|---|---|---|
| Anonymous RSS | 200 MB | 140 MB |
| Swap | 0 MB | 60 MB |
| Dynamic memory | 200 MB | 200 MB |
Google Play’s memory thresholds
Google Play evaluates dynamic memory usage against thresholds that depend on the device’s RAM and what the app is doing. For the gallery, browsing photos and continuing an upload after the user leaves fall into different app states.
Android vitals groups readings by these states:
| State | What it means for the gallery |
|---|---|
| Foreground | The gallery is visible while the user browses photos. |
| User-perceived services | The gallery continues an upload through a foreground service after the user leaves. |
| Background | The gallery is running a background service without a visible screen. |
Google Play applies lower thresholds to user-perceived services and background work than to a visible app. It evaluates usage using p90 readings and the last 28 days of data. A p90 of 1.7 GB means that roughly 90% of sampled readings are at or below 1.7 GB.
As of September 2026, Google Play has announced the following app thresholds, which are scheduled to take effect in February 2027. Google Play’s requirements include the exact RAM-tier boundaries, exceptions, and separate thresholds for games.
| Play RAM tier | Foreground p90 | User-perceived services / background p90 |
|---|---|---|
| 4 GB | 2 GB | 1 GB |
| 6 GB | 2.25 GB | 1.25 GB |
| 8 GB | 2.25 GB | 1.5 GB |
| 12 GB | 3.25 GB | 1.75 GB |
| 16 GB | 4.25 GB | 2 GB |
In Play’s 4 GB tier, 1.5 GB is below the foreground threshold but above the background threshold. Combining both states into one number can hide that difference.
Investigating memory usage with Measure
We’ve added Android memory monitoring to Measure to connect these measurements with session replays.
Compare releases and devices
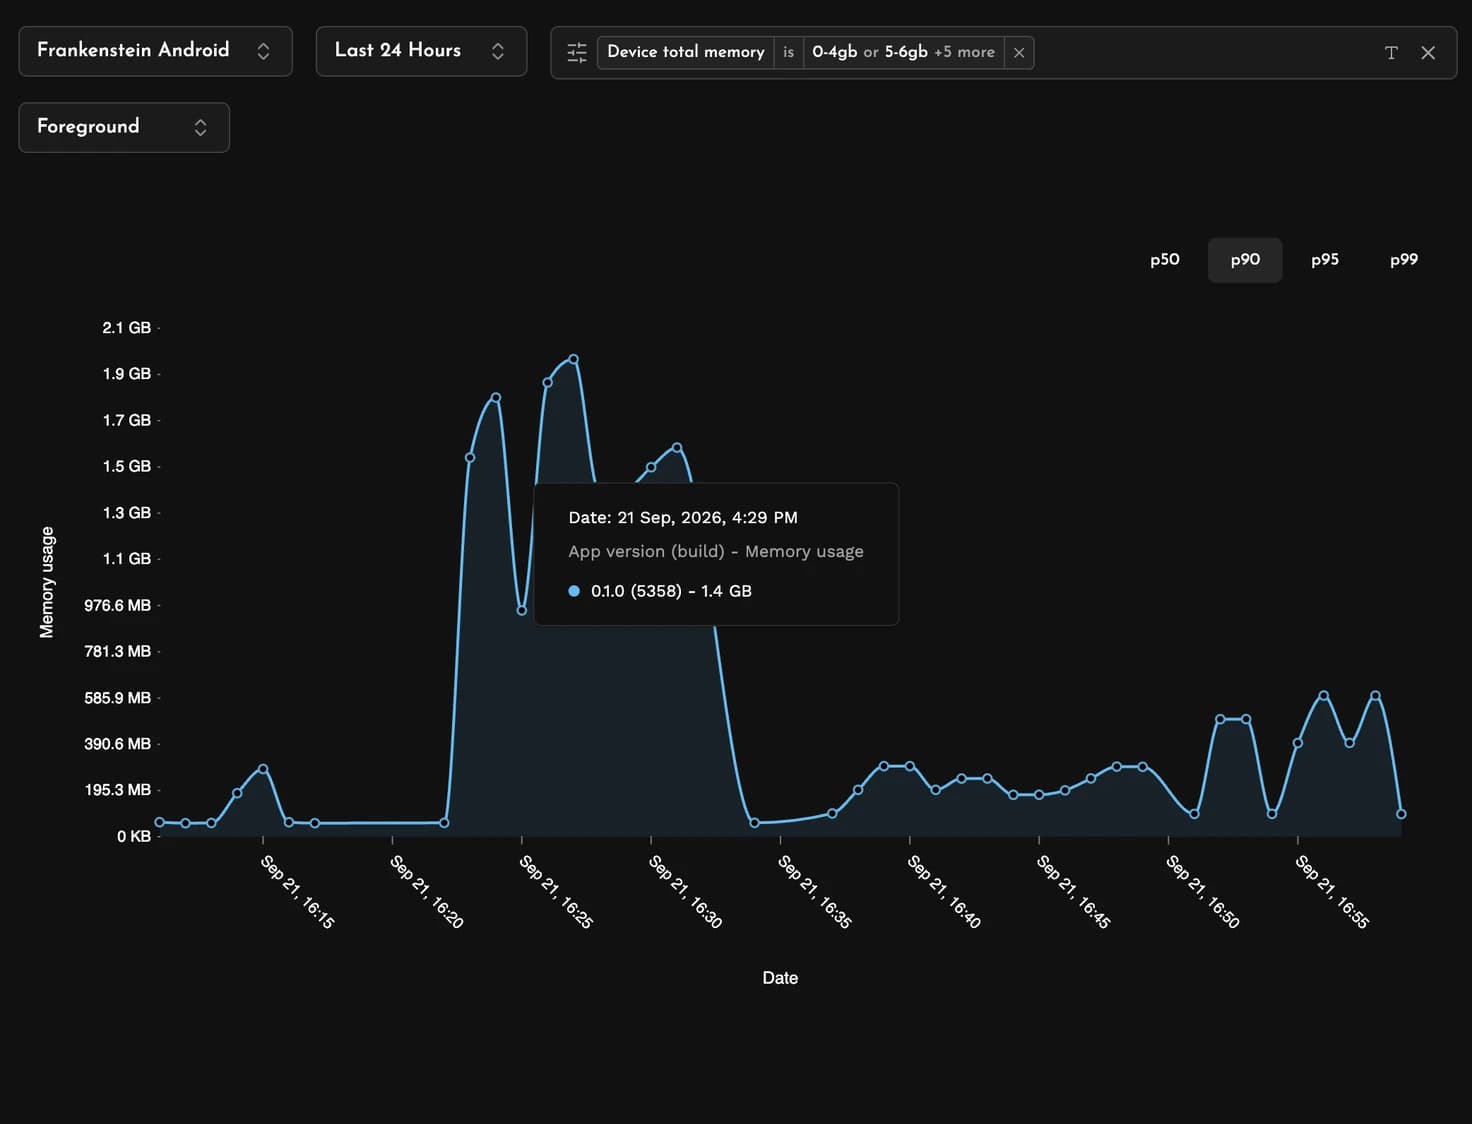
Suppose the gallery’s latest release appears to use more memory. Start on the Memory page by comparing app versions at p50, p90, or p95, then use the Device total memory breakdown to see which RAM groups are affected.
Use the App state filter to compare foreground, user_service (User-perceived services), and background readings, then focus on the state where the increase appears.
Find sessions with high memory usage
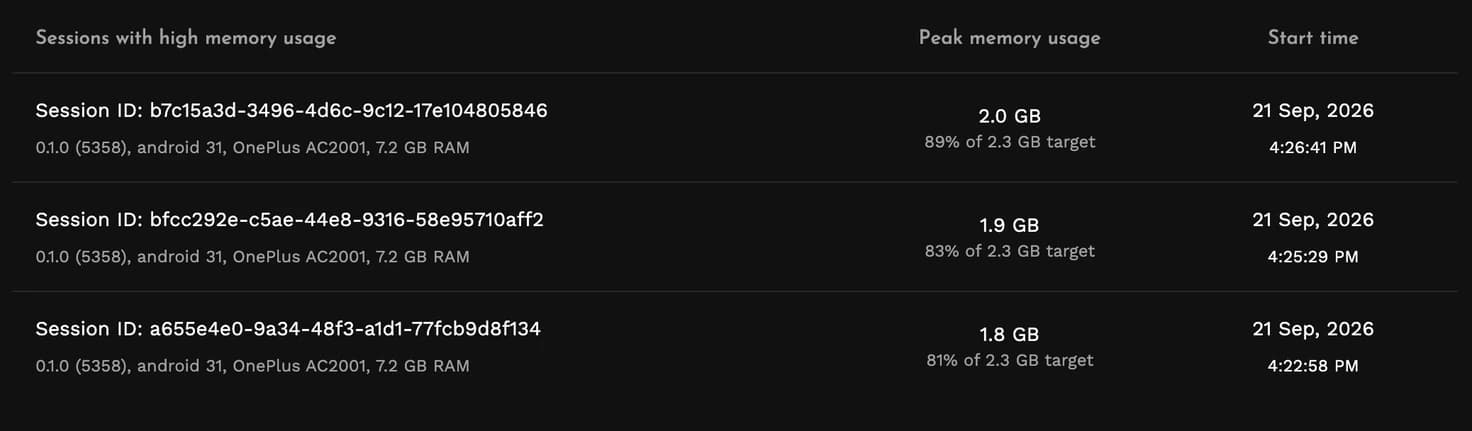
Measure flags a session when any sampled reading reaches at least 75% of its monitoring target for the device RAM group and app state.
For example, in Measure’s 0–4 GB device group, the foreground target is 2 GB, so a reading of 1.5 GB is enough to flag the session.
Measure uses its own RAM groups and monitoring targets to identify individual sessions worth investigating. A flagged session doesn’t establish whether the app exceeds Google Play’s thresholds, which are evaluated across aggregated readings.
The Sessions with high memory usage table shows each detected session’s peak usage and percentage of target. Choose one from the release and device group you’re investigating.
Investigate high memory usage
A session replay lets you see what happened in the app before memory usage increased. The memory readings appear alongside recorded events, so you can connect an increase to actions such as opening an album or loading more photos.
If native heap usage grew while the user loaded photos, image allocations are worth examining. The replay gives you a sequence of actions to reproduce, which you can then profile locally to find what accounts for the memory.
Check whether the change helped
After shipping an improvement, return to the release comparison and keep the RAM group, app state, and percentile the same. This lets you check whether memory usage has fallen for the group you were investigating. You can then open any sessions that are still flagged to see where usage remains high.
If you need more frequent readings or want to change how many sessions are sampled, you can adjust both through Adaptive Capture without shipping another app release. The Android memory monitoring guide explains how to get started.