---
Source: https://measure.sh/docs
---
# Documentation
### Table of Contents
* [**Integrate the SDK**](#integrate-the-sdk) — Set up the measure-sh SDK in your mobile app
* [**Explore Features**](#explore-features) — Discover all available features
* [**Configuration Options**](#configuration-options) — Customize SDK behavior
* [**Performance Impact**](#performance-impact) — Assess the SDK's impact on app performance
**Additional Info**
* [**SDK Upgrade Guides**](https://measure.sh/docs/sdk-upgrade-guides) — Upgrade to the latest SDK versions for Android and iOS
* [**Self-Hosting Guide**](https://measure.sh/docs/hosting) - Host measure-sh on your own infrastructure
# Integrate the SDK
Check out the [SDK Integration Guide](https://measure.sh/docs/sdk-integration-guide) to learn how to set up measure-sh for your app. Then
refer to the documentation below for details on features and how to make the best use of measure-sh for your app.
# Explore Features
Explore the following pages which include instructions and configuration options to help you understand
how to leverage different features in your mobile applications. Also, review the 'How It Works' section in each
feature's documentation to understand its underlying mechanism and enhance your ability to use it effectively.
* [**Session Timelines**](https://measure.sh/docs/features/feature-session-timelines) — Find and view session timelines
* [**Crash Reporting**](https://measure.sh/docs/features/feature-crash-reporting) — Analyze app crashes
* [**ANR Reporting**](https://measure.sh/docs/features/feature-anr-reporting) — Analyze Application Not Responding (ANR) issues
* [**Error Tracking**](https://measure.sh/docs/features/feature-error-tracking) — Track and analyze handled errors in your app
* [**Gesture Tracking**](https://measure.sh/docs/features/feature-gesture-tracking) — Automatically track user gestures in your app
* [**Performance Tracing**](https://measure.sh/docs/features/feature-performance-tracing) — Monitor app performance with traces
* [**Custom Events**](https://measure.sh/docs/features/feature-custom-events) — Capture custom events in your app
* **Bug Reporting** — Let users report bugs directly from your app
* [**Android**](https://measure.sh/docs/features/feature-bug-report-android)
* [**iOS**](https://measure.sh/docs/features/feature-bug-report-ios)
* [**Flutter**](https://measure.sh/docs/features/feature-bug-report-flutter)
* [**Screenshot Masking for SwiftUI**](https://measure.sh/docs/features/feature-screenshot-masking-swiftui) — Mask sensitive content in SwiftUI views when capturing screenshots
* [**Screenshot Masking for Flutter**](https://measure.sh/docs/features/feature-screenshot-masking-flutter) — Mask sensitive content in Flutter widgets when capturing screenshots
* [**App Launch Metrics**](https://measure.sh/docs/features/feature-app-launch-metrics) — Measure app launch performance
* [**Network Monitoring**](https://measure.sh/docs/features/feature-network-monitoring) — Monitor HTTP requests and responses
* [**Network Connectivity Changes**](https://measure.sh/docs/features/feature-network-connectivity-changes) — Track when network connectivity changes
* [**Navigation & Lifecycle Tracking**](https://measure.sh/docs/features/feature-navigation-lifecycle-tracking) — Track app navigation and
lifecycle events
* [**CPU Monitoring**](https://measure.sh/docs/features/feature-cpu-monitoring) — Monitor CPU usage for every session
* [**Memory Monitoring**](https://measure.sh/docs/features/feature-memory-monitoring) — Monitor memory usage for every session
* [**Identify Users**](https://measure.sh/docs/features/feature-identify-users) — Correlate sessions with a user ID
* [**Manually Start or Stop the SDK**](https://measure.sh/docs/features/feature-manually-start-stop-sdk) — Control when data collection
happens
* [**App Size Monitoring**](https://measure.sh/docs/features/feature-app-size-monitoring) — Monitor app size changes
* [**Alert Notifications**](https://measure.sh/docs/features/feature-alerts) — Receive Crash & ANR spike alerts and Daily Summaries for core app metrics.
* [**Slack Integration**](https://measure.sh/docs/features/feature-slack-integration) — Connect Slack to receive alert notifications and daily summaries
* [**MCP Server**](https://measure.sh/docs/features/feature-mcp) — Let AI tools like Claude Code query your app's crash and error data
# Configuration Options
Measure provides a number of configuration options to customize data collection and SDK behavior. These options are
available in two ways:
* **SDK Options** — Set at initialization time in your app's code.
* **Remote Configuration Options** — Configured remotely from the Measure dashboard. Changes take effect without releasing a new
app version.
Read more about [Configuration Options](https://measure.sh/docs/features/configuration-options).
# Performance Impact
Read the [Performance Impact](https://measure.sh/docs/features/performance-impact) documentation to understand how the SDK affects your app's
performance.
---
Source: https://measure.sh/docs/sdk-integration-guide
---
# Getting Started
- [1. Create an App](#1-create-an-app)
- [2. Set Up the SDK](#2-set-up-the-sdk)
- [Android](#android)
- [iOS](#ios)
- [Flutter](#flutter)
- [React Native](#react-native)
- [Kotlin Multiplatform](#kotlin-multiplatform)
- [3. Verify Installation](#3-verify-installation)
- [4. Review Configuration Options](#4-review-configuration-options)
- [Troubleshoot](#troubleshoot)
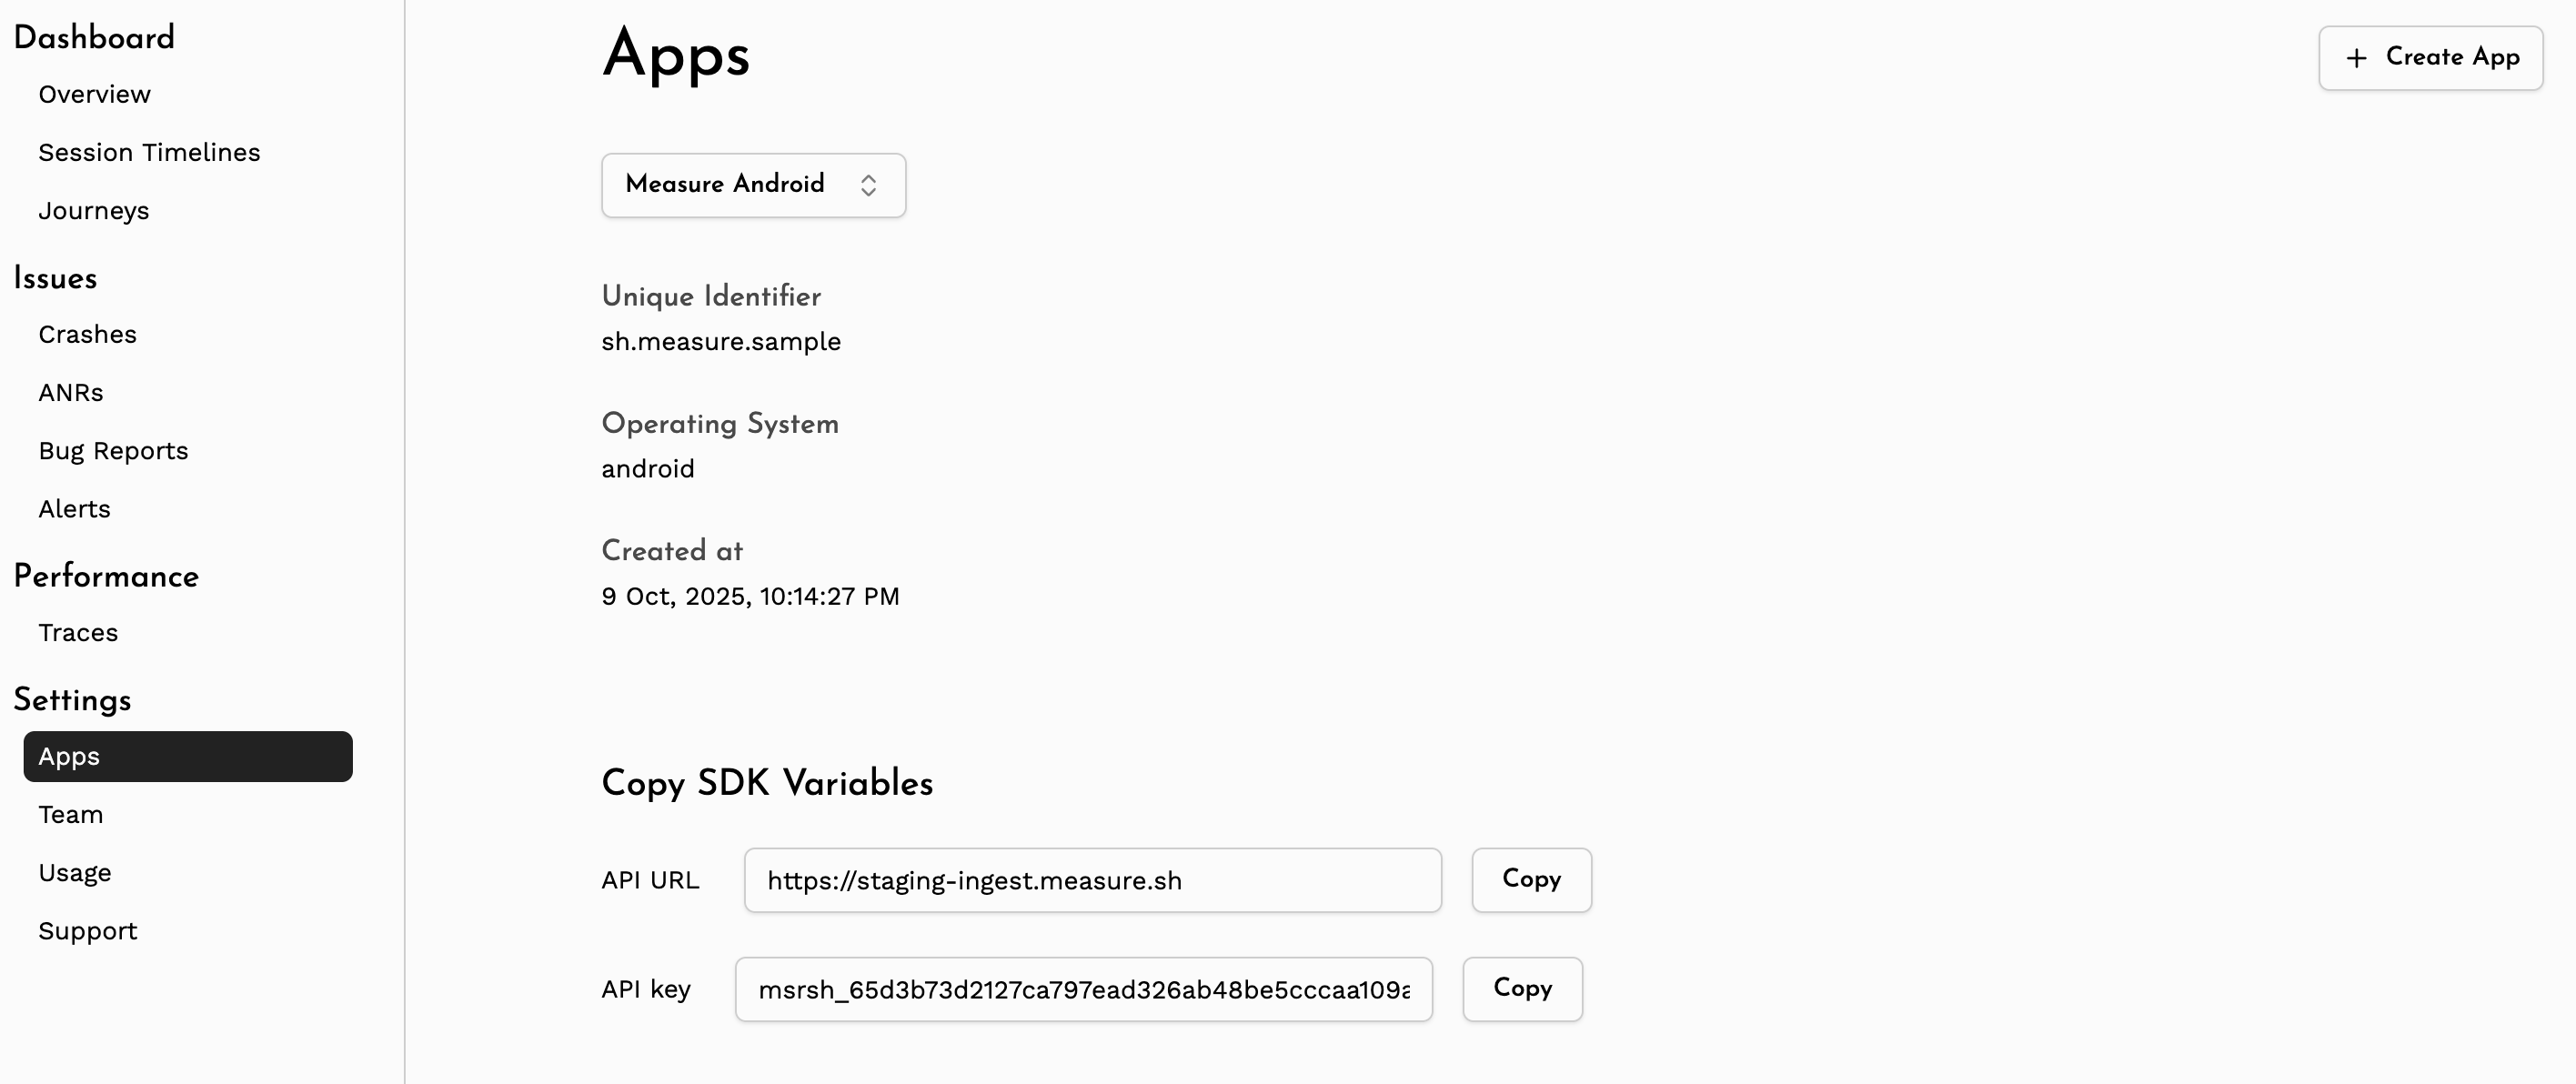
## 1. Create an App
Create a new app by visiting the _Apps_ section on the dashboard.
Once the app is created, note the `API URL` & `API Key` for your app. This will be used in the SDK configuration
in later steps.
## 2. Set Up the SDK
- [Android](#android)
- [iOS](#ios)
- [Flutter](#flutter)
- [React Native](#react-native)
- [Kotlin Multiplatform](#kotlin-multiplatform)
## Android
Minimum Requirements
| Name | Version |
| --------------------- | --------------- |
| Android Gradle Plugin | `8.1.0` |
| Min SDK | `21` (Lollipop) |
| Target SDK | `35` |
Self-host Compatibility
| SDK Version | Minimum Required Self-host Version |
| ------------------- | ---------------------------------- |
| >= `0.16.0` | `0.10.0` |
| `0.13.0` -`0.15.1` | `0.9.0` |
| `0.10.0` - `0.12.0` | `0.6.0` |
| `0.9.0` | `0.5.0` |
### Add the API Key & API URL
Add the API URL & API Key to your application's `AndroidManifest.xml` file.
```xml
```
Configure API Keys for Different Build Types
You can
use [manifestPlaceholders](https://developer.android.com/build/manage-manifests#inject_build_variables_into_the_manifest)
to configure different values for different build types or flavors.
In the `build.gradle.kts` file:
```kotlin
android {
buildTypes {
debug {
manifestPlaceholders["measureApiKey"] = "YOUR_API_KEY"
manifestPlaceholders["measureApiUrl"] = "YOUR_API_URL"
}
release {
manifestPlaceholders["measureApiKey"] = "YOUR_API_KEY"
manifestPlaceholders["measureApiUrl"] = "YOUR_API_URL"
}
}
}
```
or in the `build.gradle` file:
```groovy
android {
buildTypes {
debug {
manifestPlaceholders = ["measureApiKey": "YOUR_API_KEY"]
manifestPlaceholders = ["measureApiUrl": "YOUR_API_URL"]
}
release {
manifestPlaceholders = ["measureApiKey": "YOUR_API_KEY"]
manifestPlaceholders = ["measureApiUrl": "YOUR_API_URL"]
}
}
}
```
Then add the following in the `AndroidManifest.xml` file:
```xml
```
### Add the Gradle Plugin
Add the following plugin to your project.
```kotlin
plugins {
id("sh.measure.android.gradle") version "0.13.0"
}
```
or, use the following if you're using `build.gradle`.
```groovy
plugins {
id 'sh.measure.android.gradle' version '0.13.0'
}
```
Configure Variants
By default, the plugin is applied to all variants. To disable the plugin for specific variants, use the `measure` block
in your build file.
> [!IMPORTANT]
> Setting `enabled` to `false` will disable the plugin for that variant. This prevents the plugin from
> collecting `mapping.txt` file and other build information about the app. Features like tracking app size,
> de-obfuscating
> stack traces, etc. will not work.
For example, to disable the plugin for `debug` variants, add the following to your `build.gradle.kts` file:
```kotlin
measure {
variantFilter {
if (name.contains("debug")) {
enabled = false
}
}
}
```
or in the `build.gradle` file:
```groovy
measure {
variantFilter {
if (name.contains("debug")) {
enabled = false
}
}
}
```
### Add the SDK
Add the following to your app's `build.gradle.kts` file.
```kotlin
implementation("sh.measure:measure-android:0.18.0")
```
or, add the following to your app's `build.gradle` file.
```groovy
implementation 'sh.measure:measure-android:0.18.0'
```
### Initialize the SDK
Add the following to your app's Application class `onCreate` method.
> [!IMPORTANT]
> To be able to detect early crashes and accurate launch time metrics, initialize the SDK as soon as possible in
> Application `onCreate` method.
```kotlin
Measure.init(
context, MeasureConfig(
// Enable full collection in debug mode
// to verify installation
enableFullCollectionMode = true,
)
)
```
### Enable Full Collection Mode
The init snippet above sets `enableFullCollectionMode = true`, which forces all data to be sent to the server
regardless of sampling. This makes it easy to verify the installation by confirming that events from your app
are reaching the dashboard.
> [!IMPORTANT]
> Enabling full collection mode in production can lead to high costs. Disable or remove this flag for release
> builds and rely on sampling instead. See [Configuration Options](https://measure.sh/docs/features/configuration-options) for details.
See the [troubleshooting](#troubleshoot) section if you face any issues.
## iOS
Minimum Requirements
| Name | Version |
| ----------------------- | ------- |
| Xcode | 15.0+ |
| Minimum iOS Deployments | 12.0+ |
| Swift Version | 5.10+ |
Self-host Compatibility
| SDK Version | Minimum Required Self-host Version |
| ----------- | ---------------------------------- |
| >=0.1.0 | 0.6.0 |
| >=0.7.0 | 0.9.0 |
### Install the SDK
Measure SDK supports **CocoaPods** and **Swift Package Manager (SPM)** for installation.
#### Using CocoaPods
[CocoaPods](https://cocoapods.org) is a dependency manager for Cocoa projects. For usage and installation instructions,
visit their website. To integrate MeasureSDK into your Xcode project using CocoaPods, specify it in your `Podfile`:
```ruby
pod 'measure-sh'
```
> [!NOTE]
> MeasureSDK must be linked statically. If you are using `use_frameworks!` in your Podfile, you will need to ensure `measure-sh` is linked statically, as dynamic linking is not supported.
CocoaPods does not natively support per-pod linkage overrides. You will need to install the [`cocoapods-pod-linkage`](https://github.com/microsoft/cocoapods-pod-linkage) plugin:
```sh
gem install cocoapods-pod-linkage
```
Then add the plugin and linkage option to your `Podfile`:
```ruby
plugin 'cocoapods-pod-linkage'
target 'YourApp' do
use_frameworks!
pod 'measure-sh', :linkage => :static
# ... rest of your pods
end
```
Alternatively, if all your pods can be linked statically, you can use:
```ruby
use_frameworks! :linkage => :static
```
#### Using Swift Package Manager
The [Swift Package Manager](https://swift.org/package-manager/) is a tool for automating the distribution of Swift code
and is integrated into the `swift` compiler.
Add Measure as a dependency by adding `dependencies` value to your `Package.swift` or the Package list in Xcode.
```swift
dependencies: [
.package(url: "https://github.com/measure-sh/measure.git", branch: "ios-v0.11.0")
]
```
### Initialize the SDK
Add the following to your AppDelegate's `application(_:didFinishLaunchingWithOptions:)` to capture early crashes and
launch time metrics.
> [!IMPORTANT]
> To detect early crashes and ensure accurate launch time metrics, initialize the SDK as soon as possible
> in `application(_:didFinishLaunchingWithOptions:)`.
```swift
import Measure
func application(_ application: UIApplication,
didFinishLaunchingWithOptions launchOptions: [UIApplication.LaunchOptionsKey: Any]?) -> Bool {
let config = BaseMeasureConfig(
// Set to true to track all sessions
// useful to verify the installation
enableFullCollectionMode: true
)
let clientInfo = ClientInfo(apiKey: "", apiUrl: "")
Measure.initialize(with: clientInfo, config: config)
return true
}
```
```objc
#import
- (BOOL)application:(UIApplication *)application didFinishLaunchingWithOptions:(NSDictionary *)launchOptions {
ClientInfo *clientInfo = [[ClientInfo alloc] initWithApiKey:@"" apiUrl:@""];
BaseMeasureConfig *config = [[BaseMeasureConfig alloc] initWithEnableLogging:YES
autoStart:YES
requestHeadersProvider:NULL
maxDiskUsageInMb:50
enableFullCollectionMode:YES
enableDiagnosticMode:NO
enableDiagnosticModeGesture:NO];
[Measure initializeWith:clientInfo config:config];
return YES;
}
```
### Enable Full Collection Mode
The init snippet above sets `enableFullCollectionMode` to `true`, which forces all data to be sent to the
server regardless of sampling. This makes it easy to verify the installation by confirming that events from
your app are reaching the dashboard.
> [!IMPORTANT]
> Enabling full collection mode in production can lead to high costs. Disable or remove this flag for release
> builds and rely on sampling instead. See [Configuration Options](https://measure.sh/docs/features/configuration-options) for details.
## Flutter
The Flutter SDK currently supports only Android and iOS targets and is not available for web or desktop. The
SDK depends on the native Android and iOS SDKs, so all the minimum requirements for Android and iOS apply to the
Flutter SDK as well.
Minimum Requirements
| Name | Version |
| ------- | ------- |
| Flutter | `3.24` |
Self-host Compatibility
| SDK Version | Minimum Required Self-host Version |
| ----------- | ---------------------------------- |
| >= `0.4.0` | `0.10.0` (releasing soon) |
| >= `0.3.0` | `0.9.0` |
| >= `0.1.0` | `0.8.0` |
### Install the SDK
Add the following dependency to your `pubspec.yaml` file:
```yaml
dependencies:
measure_flutter: ^0.6.0
```
### Initialize the SDK
To initialize the SDK, you need to call the `Measure.instance.init` method in your `main` function.
- Run app inside the callback passed to the `init` method. This ensures that the Measure SDK can set up error handlers
to track uncaught exceptions.
- Wrap your app with the `MeasureWidget`, this is required for gesture tracking and screenshots.
> [!IMPORTANT]
> To detect early native crashes and to ensure accurate launch time metrics, initialize the Android SDK in
> `Application` class as described in the [Android](#initialize-the-sdk) section and the iOS SDK in `AppDelegate` as
> described in
> the [iOS](#initialize-the-sdk-1) section. It is highly recommended to initialize both native SDKs even when using the
> Flutter SDK.
```dart
Future main() async {
await Measure.instance.init(
() =>
runApp(
// wrap your app with MeasureWidget
MeasureWidget(child: MyApp()),
),
// SDK configuration
config: const MeasureConfig(
enableLogging: true,
),
);
}
```
This does the following:
- Initializes the Measure SDK with the provided `config`.
- Wraps your app with the `MeasureWidget` for gesture detection and layout snapshots.
- Sets up the error handlers to track uncaught exceptions.
### Enable Full Collection Mode
The Flutter SDK depends on the native SDKs, so `enableFullCollectionMode` must be set to `true` in both the
Android and iOS native SDK initializations (see the Android and iOS sections above). This forces all data to
be sent to the server regardless of sampling, which makes it easy to verify the installation by confirming
that events from your app are reaching the dashboard.
> [!IMPORTANT]
> Enabling full collection mode in production can lead to high costs. Disable or remove this flag for release
> builds and rely on sampling instead. See [Configuration Options](https://measure.sh/docs/features/configuration-options) for details.
### Flutter Android Setup
Measure Flutter SDK depends on the native Android SDK, so you need to follow all the steps mentioned in the
[Android](#android) section to set up the Android SDK properly.
1. [Add API Key & API URL to Android Manifest](#add-the-api-key--api-url)
2. [Add Android Gradle Plugin](#add-the-gradle-plugin)
3. [Initialize the SDK](#initialize-the-sdk)
### Flutter iOS Setup
Measure Flutter SDK depends on the native iOS SDK, so you need to follow all the steps mentioned in the
[iOS](#ios) section to set up the iOS SDK properly.
1. [Install the SDK using CocoaPods or SPM](#install-the-sdk)
2. [Initialize the SDK](#initialize-the-sdk-1)
### Track navigation
See [Navigation Monitoring](https://measure.sh/docs/features/feature-navigation-lifecycle-tracking) for instructions on how to track
navigation events.
### Track http requests
See [Network Monitoring](https://measure.sh/docs/features/feature-network-monitoring) for instructions on how to track HTTP requests.
### Gesture tracking & Layout Snapshots
The Flutter SDK automatically captures gestures like clicks, long clicks and scrolls. It also captures layout snapshots
on every click to help visualize user interactions. To enable these features, simply wrap your app with the
`MeasureWidget` as shown in the initialization step above.
Read more about adding custom widget names in the layout snapshots
in [Gesture Tracking & Layout Snapshots](https://measure.sh/docs/features/feature-gesture-tracking).
## React Native
The React Native SDK supports both **Expo** and **Vanilla React Native** projects on Android and iOS.
Minimum Requirements
| Name | Version |
| ------------ | -------- |
| React Native | `0.72.0` |
| React | `18.2.0` |
> [!IMPORTANT]
> Symbolication support for Over-The-Air (OTA) releases is coming soon.
### Install the SDK
```sh
npm install @measuresh/react-native@0.1.1
```
or with yarn:
```sh
yarn add @measuresh/react-native@0.1.1
```
---
### Expo
The recommended setup for Expo projects uses the Measure config plugin, which automates the native configuration for both Android and iOS.
#### 1. Add the plugin to `app.json`
```json
{
"expo": {
"plugins": [
[
"@measuresh/react-native",
{
"androidApiKey": "",
"androidApiUrl": "",
"iosApiKey": "",
"iosApiUrl": ""
}
]
]
}
}
```
The plugin automatically handles:
**Android**
- Injects `sh.measure.android.API_KEY` and `sh.measure.android.API_URL` into `AndroidManifest.xml`
- Adds the Measure Gradle plugin to the project build files
- Adds the `measure-android` dependency to `app/build.gradle`
**iOS**
- Adds the `MeasureReactNative` pod to `Podfile`
- Adds `export SOURCEMAP_FILE="$(pwd)/main.jsbundle.map"` to the "Bundle React Native code and images" build phase so a sourcemap is generated on every Release build
- Adds an "Upload Measure Symbol Files" build phase that automatically uploads dSYM files and the JavaScript sourcemap after each Release build
#### 2. Run prebuild
```sh
npx expo prebuild
```
#### 3. Initialize the SDK
Call `Measure.init` as early as possible in your app entry point:
```typescript
import { Measure, MeasureConfig } from "@measuresh/react-native";
import { useEffect } from "react";
export default function App() {
useEffect(() => {
Measure.init({
config: new MeasureConfig({ autoStart: true }),
});
}, []);
// ...
}
```
#### 4. Build and run
```sh
# Android
npx expo run:android
# iOS
npx expo run:ios
```
---
### Vanilla React Native
#### Android setup
Step 1 — Add API credentials to `AndroidManifest.xml`
```xml
```
**Step 2 — Add the Gradle plugin**
In your project-level `build.gradle`:
```groovy
buildscript {
dependencies {
classpath("sh.measure.android.gradle:sh.measure.android.gradle.gradle.plugin:0.13.0")
}
}
```
In your app-level `build.gradle` (after all other plugins):
```groovy
apply plugin: "sh.measure.android.gradle"
```
The Gradle plugin automatically uploads ProGuard/R8 mapping files and JavaScript sourcemaps after every `assembleRelease` or `bundleRelease` build — no manual upload step is needed.
#### iOS setup
**Step 1 — Add the pod**
In your `Podfile`:
```ruby
pod 'MeasureReactNative', :path => '../node_modules/@measuresh/react-native'
```
Then run:
```sh
pod install
```
**Step 2 — Enable sourcemap generation**
In Xcode, open your target → Build Phases → **"Bundle React Native code and images"** and add this line at the top of the script:
```sh
export SOURCEMAP_FILE="$(pwd)/main.jsbundle.map"
```
**Step 3 — Add the upload build phase**
Add a new Run Script build phase **after** the bundle phase:
```sh
"$SRCROOT/../node_modules/@measuresh/react-native/scripts/upload_build_phase.sh" \
"" \
""
```
This script automatically uploads dSYM files and the JavaScript sourcemap after each Release build. See the caution note below about when to run it.
> [!CAUTION]
> The upload script runs on every build in the configuration you add it to. To restrict it to Archive builds only, wrap the script content in:
>
> ```sh
> if [ "$ACTION" = "archive" ]; then
> # script content here
> fi
> ```
#### Initialize the SDK
Call `Measure.init` as early as possible in your app entry point:
```typescript
import { Measure, MeasureConfig } from "@measuresh/react-native";
import { useEffect } from "react";
export default function App() {
useEffect(() => {
Measure.init({
config: new MeasureConfig({ autoStart: true }),
});
}, []);
// ...
}
```
#### Build and run
```sh
# Android
npx react-native run-android
# iOS
npx react-native run-ios
```
---
### Track navigation
See [Navigation Monitoring](https://measure.sh/docs/features/feature-navigation-lifecycle-tracking) for instructions on how to track navigation events.
### Track http requests
See [Network Monitoring](https://measure.sh/docs/features/feature-network-monitoring) for instructions on how to track HTTP requests.
## Kotlin Multiplatform
The KMP SDK provides access to Measure API from shared Kotlin code (`commonMain`) on Android and iOS.
It is a thin wrapper over the native Android and iOS SDKs, so all the minimum requirements for Android
and iOS apply to the KMP SDK as well.
### Minimum Requirements
| Name | Version |
| --------------------- | ------------------- |
| Kotlin | `2.x` |
| Measure Android SDK | `0.18.0` |
| Measure iOS SDK | `0.11.0` |
The SDK is built with Kotlin `2.3.20`. Use a compatible Kotlin `2.x` toolchain in your project.
### Add the Native SDKs
The KMP SDK does not have its own initialization API. You initialize each native SDK in its own platform
target (as described in the [Android](#android) and [iOS](#ios) sections), and then use
`sh.measure.kmp.Measure` from shared code.
### Add KMP SDK
Add the dependency to the `commonMain` source set of your shared module's `build.gradle.kts` file:
```kotlin
kotlin {
sourceSets {
commonMain.dependencies {
implementation("sh.measure:measure-kmp:0.1.0")
}
}
}
```
### Use the SDK from shared code
Once both native SDKs are initialized, you can call any API from `sh.measure.kmp.Measure` in `commonMain`:
```kotlin
import sh.measure.kmp.Measure
import sh.measure.kmp.attributes.StringAttr
Measure.trackScreenView("CheckoutScreen")
Measure.trackEvent(
name = "checkout_completed",
attributes = mapOf("source" to StringAttr("kmp")),
)
```
### Crashes from shared Kotlin code on iOS
Crashes from unhandled exceptions in shared Kotlin code are captured automatically on iOS, no extra
setup is required. The SDK installs a Kotlin exception hook on load and forwards the crash, with its
Kotlin stack frames preserved.
## 3. Verify Installation
Launch the app with the SDK integrated and navigate through a few screens. The data is sent to the server periodically,
so it may take a few seconds to appear. Checkout the `Usage` section in the dashboard or navigate to the
`Session Timelines` tab to see the data.
🎉 Congratulations! You have successfully integrated Measure into your app!
---
## 4. Review Configuration Options
There are several configuration options available to customize the SDK behavior. Some options can be set during SDK
initialization, while others can be configured remotely from the dashboard. Review the [Configuration Options](https://measure.sh/docs/features/configuration-options)
section to learn more about these options and how to use them effectively.
For debug builds, it's recommended to set `enableFullCollectionMode` to `true` during initialization to ensure all data is
collected for verification purposes. In release builds, you can adjust the sampling rates and other settings as needed
to balance signal vs noise and optimize costs.
## Troubleshoot
### Enable full collection mode for debug builds
Set `enableFullCollectionMode` to `true`, which would enforce all data to be sent to the server. Do note that for
production this can lead to high costs, so it should only be used for debugging purposes.
Android
```kotlin
val config = MeasureConfig(
enableFullCollectionMode = true,
)
Measure.init(context, config)
```
iOS
```swift
let config = BaseMeasureConfig(
enableFullCollectionMode: true
)
Measure.initialize(with: clientInfo, config: config)
```
Flutter
Flutter SDK depends on the native SDKs, so you need to set `enableFullCollectionMode` to `true` in both
Android and iOS native SDK initializations.
### Verify API URL and API Key
If you are not seeing any data in the dashboard, verify that the API URL and API key are set correctly in your app.
Android
If logs show any of the following errors, make sure you have added the API URL and API key in your `AndroidManifest.xml`
file.
```
sh.measure.android.API_URL is missing in the manifest
sh.measure.android.API_KEY is missing in the manifest
```
iOS
Verify the API URL and API key are set correctly in the `ClientInfo` object when initializing the SDK.
```swift
let config = BaseMeasureConfig()
let clientInfo = ClientInfo(apiKey: "", apiUrl: "")
Measure.initialize(with: clientInfo, config: config)
```
Flutter
Flutter SDK depends on the native SDKs, so verify that the API URL and API key are set correctly in both
Android and iOS native SDK initializations.
React Native
**Expo:** Verify that `androidApiKey`, `androidApiUrl`, `iosApiKey`, and `iosApiUrl` are all set in the plugin options in `app.json` and that `npx expo prebuild` has been run.
**Vanilla React Native:** Verify the API key and URL are present in `AndroidManifest.xml` (Android) and that the upload build phase script has the correct API key and URL (iOS).
### Flutter iOS — MeasureSDK must be linked statically
Flutter adds `use_frameworks!` to the iOS `Podfile` by default, which causes CocoaPods to link all pods dynamically. MeasureSDK must be linked statically and will not work correctly with dynamic linking.
To fix this, follow the [CocoaPods static linking instructions](#using-cocoapods) in the iOS setup section.
### Connecting to Locally-hosted Server (for self-host customers)
**iOS**
If you are running the measure-sh server on your machine, setting the API_URL to localhost:8080 will work on the
simulator because it can access localhost. However, a physical device cannot access your computer's localhost.
To resolve this, you can use [ngrok](https://ngrok.com/) or a similar service to provide a public URL to your local
server. This allows your physical device to connect to the server.
**Android**
For Android, if your device is on the same network as your computer, you can use your computer's local IP address (e.g.,
192.168.1.X:8080) as the API_URL. Alternatively, you can set up ADB port forwarding with the command `adb reverse tcp:
8080 tcp:8080` to allow the device to connect to the server.
When using an Android emulator, you can set the API_URL to http://10.0.2.2:8080 to access the server running on your
machine.
Alternatively, you can use [ngrok](https://ngrok.com/) or a similar service to provide a public URL to your local
server. This allows your Android emulator or physical device to connect to the server.
### Enable Logs
Android
Enable logging during SDK initialization. All Measure SDK logs use the tag `Measure`.
```kotlin
val config = MeasureConfig(enableLogging = true)
Measure.init(context, config)
```
iOS
Enable logging during SDK initialization.
```swift
let config = BaseMeasureConfig(enableLogging: true)
Measure.initialize(with: clientInfo, config: config)
```
Flutter
Enable logging during SDK initialization.
```dart
await Measure.instance.init(() => runApp(MeasureWidget(child: MyApp())),
config: const MeasureConfig(enableLogging:true));
```
React Native
Enable logging during SDK initialization.
```typescript
const config = new MeasureConfig({ enableLogging: true });
await Measure.init({ config });
```
### Connecting to a Self-hosted Server
If you are hosting the server in cloud. Make sure the API URL is set to the public URL of your server.
For example: set the API URL to `https://measure-api..com`, replacing with your own domain.
### Contact Support
If none of the above steps resolve the issue, feel free to reach out to us on [Discord](https://discord.gg/f6zGkBCt42)
for further
assistance.
### Enable Diagnostic Mode
If you're experiencing issues with the SDK and need to share detailed logs with us, enable diagnostic mode.
This writes all internal SDK logs to files on disk which can then be pulled from the device and shared
when reporting a bug.
> [!NOTE]
> These files only contain Measure SDK logs, not your app's logs.
#### Step 1: Enable diagnostic mode
Android
Enable diagnostic mode during SDK initialization.
```kotlin
val config = MeasureConfig(enableDiagnosticMode = true)
Measure.init(context, config)
```
iOS
Enable diagnostic mode during SDK initialization. iOS provides an additional option called `enableDiagnosticModeGesture`. When this flag is enabled, you can use double finger double tap gesture to open share sheet and send logs immediately.
```swift
let config = BaseMeasureConfig(enableDiagnosticMode: true, enableDiagnosticModeGesture: true)
Measure.initialize(with: clientInfo, config: config)
```
Flutter
Enable diagnostic mode during SDK initialization.
```dart
await Measure.instance.init(
() => runApp(MeasureWidget(child: MyApp())),
config: const MeasureConfig(enableDiagnosticMode: true),
);
```
On iOS, the `enableDiagnosticModeGesture` flag is set on the native `BaseMeasureConfig` in your `AppDelegate` (see the iOS section above), not on the Dart `MeasureConfig`.
React Native
Enable diagnostic mode during SDK initialization.
```typescript
const config = new MeasureConfig({ enableDiagnosticMode: true });
await Measure.init({ config });
```
On iOS, the `enableDiagnosticModeGesture` flag is set on the native `BaseMeasureConfig` in your `AppDelegate` (see the iOS section above), not on the Dart `MeasureConfig`.
#### Step 2: Reproduce the issue
Run the app and reproduce the issue you're facing. The SDK will write logs to files in the
app's internal storage.
#### Step 3: Pull the log files
Android
Use `adb` to retrieve the log files from the device:
```shell
# List all diagnostic log files
adb shell run-as ls files/measure/sdk_debug_logs/
# Pull all log files as a tar.gz archive
adb shell "run-as tar czf - files/measure/sdk_debug_logs/" > /tmp/sdk_debug_logs.tar.gz
```
iOS
iOS provides an option called `enableDiagnosticModeGesture`. When this flag is enabled, you can use double finger double tap gesture to open share sheet and send logs immediately.
```swift
let config = BaseMeasureConfig(enableDiagnosticMode: true, enableDiagnosticModeGesture: true)
Measure.initialize(with: clientInfo, config: config)
```
#### Step 4: Share the files
Share the pulled log files on [Discord](https://discord.gg/f6zGkBCt42) or send them to us via email
for us to investigate.
#### Step 5: Disable diagnostic mode
Once you've collected the logs, disable diagnostic mode by removing the `enableDiagnosticMode` flag
or setting it to `false`. You can also delete the log files from the device:
Android
```shell
adb shell run-as rm -rf files/measure/sdk_debug_logs/
```
---
Source: https://measure.sh/docs/features/feature-session-timelines
---
# Session Timeline
* [**What Is a Session?**](#what-is-a-session)
* [**Session Timeline**](#session-timeline)
* [**Session Search**](#session-search)
* [**API Reference**](#api-reference)
* [**Get Current Session**](#get-current-session)
## What Is a Session?
A session is a continuous period of activity within the app. A new session is created each time the SDK is initialized or when the app comes back to foreground after 30 seconds of being in background.
## Session Timeline
The session timeline provides a detailed, chronological view of all events during a session. You can see the exact order of actions leading up to an issue, making it easier to spot problems. The timeline also includes memory and CPU usage graphs to help you understand how the app was performing at different moments.
Additionally, screenshots and layout snapshots give you a window into what the user saw at the time. This visual context helps you catch UI issues, performance bottlenecks or anything else that might not be obvious just from logs.
Session timelines are automatically collected for sessions with Crashes and Bug Reports. Each session timeline includes all events that occurred 5 minutes before the issue, giving you deep context on what led to the problem.
See [Configuration Options](https://measure.sh/docs/configuration-options) for details on how to configure sampling rates for session timeline.
## Session Search
You can easily find session timelines using attributes like user ID, session ID, device model, app version, OS version, country and more. You can also search based on specific events, such as when a view was clicked or a screen was visited. This is particularly useful for investigating user- or device-specific issues.
The session search supports all custom events and attributes defined in your app, allowing you to filter sessions based on custom data like feature flags or user actions.
> [!TIP]
>
> Construct complex queries easily using the filters UI and search box on the sessions page. For example, "find all sessions for 'premium' users in the 'US' using >'Android 16 or above', with the 'latest app version' that have a 'click' event on a view with ID 'btn_order_now'."
## API Reference
### Get Current Session
You can retrieve the current session using the `getSessionId` method. This is useful when you want to send the session ID to a different service or log it for debugging purposes.
#### Android
```kotlin
val sessionId = Measure.getSessionId()
```
#### iOS
Using Swift:
```swift
let sessionId = Measure.getSessionId()
```
or, in Objective-C:
```objc
NSString *sessionId = [Measure getSessionId];
```
#### Flutter
```dart
final String? sessionId = await Measure.instance.getSessionId();
```
#### React Native
```ts
const sessionId = await Measure.getSessionId();
```
---
Source: https://measure.sh/docs/features/feature-crash-reporting
---
# Crash Reporting
Crashes are automatically tracked, optionally with a snapshot of the app's UI at the time of the crash.
* [**Metrics**](#metrics)
* [Crash-Free Rate](#crash-free-rate)
* [Perceived Crash Rate](#perceived-crash-rate)
* [**Get a UI Snapshot**](#get-a-ui-snapshot)
* [**Crash Grouping**](#crash-grouping)
* [**API Reference**](#api-reference)
* [**Symbolicate Stacktrace**](#symbolicate-stacktrace)
* [**How It Works**](#how-it-works)
> [!NOTE]
> Crash reporting for native crashes (from C/C++/etc.) is not yet supported. Track the progress [here](https://github.com/measure-sh/measure/issues/103). Upvote and comment on the issue if you are looking forward to this feature.
## Metrics
Metrics related to crashes are automatically computed and shown on the dashboard.

### Crash-Free Rate
The crash-free rate indicates the percentage of sessions that did not experience any crashes. It is calculated as follows:
```
Crash-Free Rate = (Total Sessions - Crashed Sessions) / Total Sessions * 100
```
Where:
- **Total Sessions**: The total number of sessions recorded.
- **Crashed Sessions**: The number of sessions that experienced a crash.
- **Crash-Free Rate**: The percentage of sessions that did not crash.
The crash-free rate is a key metric to monitor the stability of your app. A higher crash-free rate indicates a more stable app, while a lower rate suggests that users are experiencing issues that need to be addressed.
### Perceived Crash Rate
The perceived crash rate indicates the percentage of sessions that experienced a crash when the user was actively using the app. It is calculated as follows:
```
Perceived Crash Rate = Crashed Sessions When App Is in Foreground / Total Sessions * 100
```
Where:
- **Crashed Sessions When App Is in Foreground**: The number of sessions that experienced a crash while the app was actively being used by the user.
- **Total Sessions**: The total number of sessions recorded.
## Get a UI Snapshot
A screenshot of the app is captured when an app crashes. This feature is enabled by default and can be
remotely configured on the dashboard under the "Apps" section. The following configuration options are available:
- `Capture Screenshot on Crash` — Enables or disables the automatic screenshot capture on crash. It is enabled by default.
- `Mask Sensitive Information` — Masks sensitive information in the screenshot by blurring text fields and
password fields. It is disabled by default.
Note that on iOS a screenshot cannot be captured reliably at the time of crash, it instead captures a layout snapshot.
## Crash Grouping
Crashes are grouped to help you identify the most common issues in your app. Each group represents a unique crash, identified by the exception type and the stack trace. A percentage contribution of each crash group is also shown on the dashboard to get a quick idea about the impact of the issue.
### Android
Exceptions in Android (JVM) are grouped based on the exception type and the stack trace. Crashes with the same type and the same method name and file name from the _first frame_ of the stack trace are grouped together.
For example, for the following crash, the exception type is `java.lang.NullPointerException`, the method name of the first frame is `onCreate` and the file name is `MainActivity.kt`:
```
java.lang.NullPointerException: Attempt to invoke virtual method 'void com.example.app.MainActivity.onCreate(android.os.Bundle)' on a null object reference
at com.example.app.MainActivity.onCreate(MainActivity.kt:10)
at android.app.Activity.performCreate(Activity.java:8000)
...
```
### iOS
Exceptions in iOS (Objective-C/Swift) are grouped based on the exception signal and the stack trace. Crashes with the same signal, for example, `SIGABRT`, the same method name and file name from the _first frame belonging to the application binary_ are grouped together.
For example, for the following crash, the signal is `SIGABRT`, the method name of the first relevant frame is `-viewDidLoad` and the file name is `MainViewController.m`:
```
Exception Type: EXC_CRASH (SIGABRT)
Exception Codes: 0x0000000000000000, 0x0000000000000000
Crashed Thread: 0
Application Specific Information:
*** Terminating app due to uncaught exception 'NSInvalidArgumentException', reason: '-[MainViewController viewDidLoad]: unrecognized selector sent to instance 0x600000e2c0c0'
First Throw Call Stack:
(
0 CoreFoundation 0x000000010a2f3b6c __exceptionPreprocess + 220
1 libobjc.A.dylib 0x0000000109d8e5e1 objc_exception_throw + 48
2 MainViewController.m 0x000000010a2f3b6c -[MainViewController viewDidLoad] + 0
...
)
```
### Flutter
In Flutter, crashes are grouped based on the exception type and the stack trace. Crashes with the same exception type
and the same method name and file name from the _first frame_ of the stack trace are grouped together.
For example, for the following crash, the exception type is `FlutterError`, the method name of the first frame
is `_incrementCounter` and the file name is `main.dart`:
```
FlutterError (setState() called after dispose(): _MyHomePageState#12345(ticker: _TickerModeEnabled))
at _MyHomePageState._incrementCounter (package:my_app/main.dart:42:9)
at _MyHomePageState.build (package:my_app/main.dart:30:5)
at StatelessElement.build (package:flutter/src/widgets/framework.dart:4620:27)
...
```
### React Native
In React Native, JS exceptions are grouped based on the error message and the stack trace. Crashes with the same
message and the same function name and file name from the _first frame_ of the stack trace are grouped together.
## API Reference
### Symbolicate Stacktrace
Stack traces from crashes may be obfuscated or contain memory addresses. To convert the stack traces to a human-readable format, you need to upload the mapping or symbol files based on the platform.
#### Android
If you are using ProGuard or R8 to obfuscate your code, you need to upload the mapping files to de-obfuscate the stack traces. Measure's Android Gradle Plugin automatically uploads the ProGuard/R8 mapping file to the Measure server when you run an `assemble` gradle task.
#### iOS
To symbolicate stack traces for iOS, you need to upload the dSYM files to map the memory addresses to a human-readable format. There are two ways to upload dSYM files:
##### Using Shell Script
Run the [`upload_dsym_manual.sh`](../../ios/Scripts/upload_dsym_manual.sh) script to manually upload dSYM files after building your app.
```sh
./upload_dsym_manual.sh [custom_headers]
```
##### Using XCArchive
Run the [`upload_dsym_xcarchive.sh`](../../ios/Scripts/upload_dsym_xcarchive.sh) script to automatically upload dSYMs using `xcarchive` file. This script automatically extracts all necessary build metadata (version, build size, dSYM paths, etc.) directly from the generated .xcarchive. the `ipa` file is necessary to generate the build size info. If the ipa_path is not provided, the script uses the application binary to generate build size.
```sh
./upload_dsym_xcarchive.sh [custom_headers] [ipa_path]
```
> [!CAUTION]
> If you are using Build Phases to upload DSYMs, make sure to **upload DSYMs only for release builds**.
#### React Native
React Native apps require sourcemaps to symbolicate JavaScript stack traces. The setup differs slightly between Android and iOS.
##### Android
The Measure Android Gradle Plugin automatically captures and uploads the composed JavaScript sourcemap when you run `assembleRelease` or `bundleRelease`. No additional steps are required.
> [!IMPORTANT]
> Always use the sourcemap from the Gradle build output. Generating the sourcemap separately (e.g. via `npx react-native bundle`) produces a different bundle than what is embedded in the APK and will result in incorrect symbolication.
##### iOS
Add the `upload_build_phase.sh` script as a Run Script Build Phase in Xcode. It automatically uploads dSYM files and JavaScript sourcemaps in one step.
**Step 1 — Enable sourcemap generation**
In Xcode, open your target → Build Phases → **"Bundle React Native code and images"** and add this line at the top of the script:
```sh
export SOURCEMAP_FILE="$(pwd)/main.jsbundle.map"
```
**Step 2 — Add the upload build phase**
In Xcode, add a new Run Script Build Phase **after** the "Bundle React Native code and images" phase with the following content:
```sh
"${SRCROOT}/../node_modules/@measuresh/react-native/scripts/upload_build_phase.sh" \
"https://your-api-url.measure.sh" \
"your-api-key"
```
Replace the API URL and API key with your values from the Measure dashboard.
> [!IMPORTANT]
> Always use the sourcemap generated by the Xcode build (via `SOURCEMAP_FILE`). Generating the sourcemap manually produces a different bundle than what is embedded in the app and will result in incorrect symbolication.
> [!NOTE]
> The script runs on every build in whatever configuration you add it to. To restrict it to Archive builds only, wrap the script body in:
> ```sh
> if [ "$ACTION" = "archive" ]; then
> # script content here
> fi
> ```
#### Flutter
When obfuscating your Flutter app using --obfuscate and --split-debug-info options:
* **Android** — The Measure Android Gradle Plugin automatically uploads the required mapping files.
* **iOS** — You need to upload the dSYM files as described in the iOS section above. After building
with `flutter build ipa`, run the `upload_dsyms.sh` script using the IPA path and the path to the dSYM folder
(typically under _/build/ios/Release-iphoneos/_)
## How It Works
### Android
When an unhandled exception occurs, it is intercepted by Measure using an `UncaughtExceptionHandler`. The exception is then parsed and sent as an `exception` event. Crashes are attempted to be sent immediately, but if the app is terminated before the event is sent, it is stored locally and sent on the next app launch.
### iOS
We rely on [PLCrashReporter](https://github.com/microsoft/plcrashreporter) to detect crashes. When a crash occurs, a crash report is generated and stored locally on the device. On the next launch, the crash report is prepared and sent to the server.
### Flutter
When the SDK is initialized, it automatically sets up both `FlutterError.onError`
and `PlatformDispatcher.instance.onError` callbacks. Any errors are forwarded to the server. Internally, we rely
on [stack_trace](https://pub.dev/packages/stack_trace) to parse the stack trace and send it as an `exception` event.
All crashes captured by the native Android or iOS SDK are also tracked for Flutter apps.
### React Native
When the SDK is initialized, it automatically installs a global error handler via React Native's `ErrorUtils`
and sets up an unhandled Promise rejection tracker. Any unhandled JS exceptions and promise rejections are captured
and sent as `exception` events.
All crashes captured by the underlying native Android or iOS SDKs are also tracked for React Native apps.
---
Source: https://measure.sh/docs/features/feature-anr-reporting
---
# ANR Reporting
* [**Debugging ANRs**](#debugging-anrs)
* [**Metrics**](#metrics)
* [**Get a UI Screenshot**](#get-a-ui-screenshot)
* [**How It Works**](#how-it-works)
ANRs (Application Not Responding errors) are automatically tracked. Optionally, the SDK can also capture a screenshot of your app’s UI at the moment the crash occurred.
## Debugging ANRs
You can easily debug ANRs by following the in-depth guide in the [Android documentation](https://developer.android.com/topic/performance/anrs/diagnose-and-fix-anrs). It covers different scenarios that lead to ANRs and how to approach fixing them.
You can also use the session timelines in Measure to see what was happening in the app before the ANR occurred. The timeline shows all app activity, including CPU and Memory usage, giving you crucial context for understanding the ANR and pinpointing the cause.
Additionally, starting from Android API level 30, the Application Exit feature provides valuable insights. Measure tracks all app exit events and reports them to the server along with the stack trace. Here’s an example snippet from a trace:
```
"main" prio=5 tid=1 Blocked
at sh.measure.sample.ExceptionDemoActivity.deadLock$lambda$10(ExceptionDemoActivity.kt:66)
- waiting to lock <0x0a293e9f> (a java.lang.Object) held by thread 22
at sh.measure.sample.ExceptionDemoActivity.$r8$lambda$kc26SdTV_Hqz6i5PLOpVXKS016U(unavailable:0)
at sh.measure.sample.ExceptionDemoActivity$$ExternalSyntheticLambda9.run(unavailable:2)
at android.os.Handler.handleCallback(Handler.java:942)
at android.os.Handler.dispatchMessage(Handler.java:99)
at android.os.Looper.loopOnce(Looper.java:201)
at android.os.Looper.loop(Looper.java:288)
at android.app.ActivityThread.main(ActivityThread.java:7872)
at java.lang.reflect.Method.invoke(Native method)
at com.android.internal.os.RuntimeInit$MethodAndArgsCaller.run(RuntimeInit.java:548)
at com.android.internal.os.ZygoteInit.main(ZygoteInit.java:936)
"APP: Locker" prio=5 tid=22 Sleeping
at java.lang.Thread.sleep(Native method)
- sleeping on <0x06290e31> (a java.lang.Object)
at java.lang.Thread.sleep(Thread.java:450)
- locked <0x06290e31> (a java.lang.Object)
at java.lang.Thread.sleep(Thread.java:355)
at sh.measure.sample.ExceptionDemoActivity.sleep(ExceptionDemoActivity.kt:86)
at sh.measure.sample.ExceptionDemoActivity.access$sleep(ExceptionDemoActivity.kt:12)
at sh.measure.sample.ExceptionDemoActivity$LockerThread.run(ExceptionDemoActivity.kt:80)
- locked <0x0a293e9f> (a java.lang.Object)
```
In this example, the “main” thread is blocked, waiting to lock an object held by _thread 22_, which is sleeping and holding that lock. This creates a deadlock, leading to an ANR.
> [!NOTE]
> Starting from API 31, for native crashes, App Exit Info contains the [tombstone](https://source.android.com/docs/core/tests/debug) stack trace. Support for native crash reports is not yet implemented and will be coming soon. Track the updates in this [issue](https://github.com/measure-sh/measure/issues/103).
## Metrics

The ANR-Free Rate measures the percentage of sessions that didn’t experience any ANRs. Here’s how it’s calculated:
```
ANR-Free Rate = (Total Sessions - ANR Sessions) / Total Sessions * 100
```
Where:
- **Total Sessions**: The total number of sessions recorded.
- **ANR Sessions**: The number of sessions that experienced an ANR.
## Get a UI Screenshot
A screenshot of the app is captured when an app crashes. This feature is enabled by default and can be
remotely configured on the dashboard under the "Apps" section. The following configuration options are available:
- `Capture Screenshot on ANR` — Enables or disables the automatic screenshot capture on crash. It is enabled by default.
- `Mask Sensitive Information` — Masks sensitive information in the screenshot by blurring text fields and
password fields. It is disabled by default.
## How It Works
Measure SDK detects ANRs by tracking the `SIGQUIT` signal. When an ANR occurs, this signal is sent to the app process. The SDK picks up on this signal and reports the ANR to the server.
#### Implementation Details
* [Signal](#handling-signals)
* [Handling Signals](#handling-signals)
* [Semaphores](#semaphores)
* [Detecting SIGQUIT on Android](#detecting-sigquit-on-android)
Apart from setting a signal disposition using [sigaction](https://man7.org/linux/man-pages/man2/sigaction.2.html), a thread can also set up a [sigwait](https://man7.org/linux/man-pages/man3/sigwait.3.html). This allows the registered signals to be handled on this thread without triggering the `sigaction` handler.
## Handling Signals
Signals can be *handled* using [sigaction](https://man7.org/linux/man-pages/man2/sigaction.2.html) or [sigwait](https://man7.org/linux/man-pages/man3/sigwait.3.html) (among others which we'll not cover in this article).
### sigaction(2)
The `sigaction` system call is used to change the action taken by a process on receipt of a specific signal. The handler function provided affects how the process handles the signal (i.e., signal handler is not per thread).
> Signal handlers are per-process, but signal masks are per-thread.
### sigwait(3)
The `sigwait` function suspends execution of the calling thread until one of the signals specified in the signal set becomes `pending`. **Once a signal is processed by this thread, it is automatically cleared from the set of pending signals**. It then returns that signal number. No signal handlers set using `sigaction` are triggered for this signal once cleared by `sigwait`.
`sigwait` makes it easy to handle the signals synchronously in normal program execution.
## Semaphores
The implementation relies on Semaphores to synchronize the threads.
### sem_wait(3)
`sem_wait` decrements (locks) the semaphore. If the semaphore's value is greater than zero, then the decrement proceeds, and the function returns immediately. If the semaphore currently has the value zero, then the call blocks until it becomes possible to perform the decrement (i.e., the semaphore value rises above zero).
### sem_post(3)
`sem_post` increments (unlocks) the semaphore. If the semaphore's value consequently becomes greater than zero, then the thread blocked in a `sem_wait` call will be woken up and proceed to lock the semaphore.
## Detecting SIGQUIT on Android
Setting a signal handler using `sigaction` is the typical way to detect and track a `SIGQUIT` on a Linux system. However, Android registers [sigwait](https://man7.org/linux/man-pages/man3/sigwait.3.html) for the `SIGQUIT` signal for every app ([reference](https://android.googlesource.com/platform/art/+/refs/heads/main/runtime/signal_catcher.cc)). Hence, simply registering a `sigaction` will not have any effect as noted earlier.
1. Find the thread ID of the thread called "[Signal Catcher](https://android.googlesource.com/platform/art/+/refs/heads/main/runtime/signal_catcher.cc)". This is the thread using which Android registers the `sigwait`. Thread ID is found by looping over the directory `/proc//task/` and reading the thread name from the contents of the `comm` file in each subdirectory to find the thread name. More on this can be found [here](https://man.freebsd.org/cgi/man.cgi?apropos=0&arch=default&format=html&manpath=CentOS+7.1&query=proc&sektion=5#:~:text=%2Fproc%2F%5Bpid%5D%2Ftask%09(since%20Linux%202.6.0%2Dtest6)).
2. Create a new thread called "Watchdog" using `pthread_create` and set the signal mask to unblock the `SIGQUIT` signal using `pthread_sigmask` for this thread. This ensures that the new thread can receive the `SIGQUIT` signal instead of the _Signal Catcher_ thread.
3. Register a semaphore using [sem_wait](https://man7.org/linux/man-pages/man3/sem_wait.3.html) in the _Watchdog_ thread which blocks it until the `SIGQUIT` signal is received.
4. Register a signal handler using `sigaction` for the `SIGQUIT` signal. When `SIGQUIT` is received, the handler invokes [sem_post](https://man7.org/linux/man-pages/man3/sem_post.3.html) to unblock the _Watchdog_ thread.
5. When the _Watchdog_ thread's semaphore is unlocked, it notifies Measure SDK of an ANR by a callback using JNI.
6. Eventually, the Watchdog thread notifies the "Signal Catcher" thread to handle the signal as usual by using `syscall`:
```c
syscall(SYS_tgkill, pid, signal_catcher_tid, SIGQUIT);
```
---
Source: https://measure.sh/docs/features/feature-error-tracking
---
# Track errors
Measure automatically captures crashes and ANRs (Application Not Responding) in your app, but you can also track handled
exceptions that occur during normal app operation. This is useful for identifying issues that may not crash the app but
still affect user experience.
- [**API Reference**](#api-reference)
- [**Android**](#android)
- [**iOS**](#ios)
- [**Flutter**](#flutter)
- [**React Native**](#react-native)
## API Reference
#### Android
To track handled exceptions, use the `trackHandledException`method.
```kotlin
try {
methodThatThrows()
} catch (e: Exception) {
Measure.trackHandledException(e)
}
```
From version `0.12.0` onwards you can also add attributes to the tracked exception, which can be useful for
providing additional context about the error.
- Attribute keys must be strings with a maximum length of 256 characters.
- Attribute values must be one of the primitive types: `int`, `long`, `double`, `float` or `boolean`.
- String attribute values can have a maximum length of 256 characters.
```kotlin
try {
methodThatThrows()
} catch (e: Exception) {
val attributes = AttributesBuilder().put("screen", "Login")
.put("retryCount", 2)
.build()
Measure.trackHandledException(e, attributes)
}
```
#### iOS
To track handled errors or exceptions, use the `trackError` method with either a native Swift Error or an NSError.
```swift
do {
try someThrowingFunction()
} catch {
Measure.trackError(error)
}
```
You can optionally include attributes and enable stack trace collection.
- Attribute keys must be strings with a maximum length of 256 characters.
- Attribute values must be one of the primitive types: `int`, `long`, `double`, `float` or `boolean`.
- String attribute values can have a maximum length of 256 characters.
```swift
Measure.trackError(error, attributes: [
"screen": .string("Login"),
"retryCount": .int(2)
])
```
You can track handled NSError objects from Objective-C code as well using `trackError` method.
```objc
[Measure trackError:error attributes:@{ @"screen": @"Login", @"retryCount": 2 }];
```
#### Flutter
To track handled exceptions in Flutter, use the `trackHandledError` method from the Measure SDK.
```dart
try {
methodThatThrows();
} catch (e, stackTrace) {
Measure.trackHandledError(e, stackTrace);
}
```
#### React Native
To track handled errors, use the `trackError` method from the Measure SDK.
```ts
import { Measure } from '@measuresh/react-native';
try {
methodThatThrows();
} catch (e) {
Measure.trackError({ error: e });
}
```
You can optionally include attributes to provide additional context about the error.
- Attribute keys must be strings with a maximum length of 256 characters.
- Attribute values must be one of the primitive types: `string`, `number`, or `boolean`.
- String attribute values can have a maximum length of 256 characters.
```ts
try {
methodThatThrows();
} catch (e) {
Measure.trackError({
error: e,
attributes: {
screen: 'Login',
retryCount: 2,
},
});
}
```
---
Source: https://measure.sh/docs/features/feature-gesture-tracking
---
# Gesture Tracking
* [**Overview**](#overview)
* [**Layout Snapshots**](#layout-snapshots)
* [**Flutter**](#flutter)
* [**How it works**](#how-it-works)
* [**Android**](#android)
* [**iOS**](#ios)
* [**Flutter**](#flutter-1)
* [**Benchmark Results**](#benchmark-results)
* [**Android**](#android-1)
* [**iOS**](#ios-1)
## Overview
Measure SDK captures gestures like click, long click and scroll events automatically. These events make it easy to
understand user interactions with your app without having to manually instrument every view. Additionally,
a layout snapshot is captured at the time of the gesture, which helps in understanding the context of the gesture
and the state of the UI at that moment.
## Layout Snapshots
Layout snapshots provide a lightweight way to capture the structure of your UI at key user interactions.
They are automatically collected during click events (with throttling) and store the layout hierarchy as a wireframe
rather than full screenshots.
This approach gives valuable context about the UI state during user interactions while being significantly more
efficient to capture and store than traditional screenshots.
| Screenshot | Layout snapshot |
|------------------------------------------------------|------------------------------------------------|
|  |  |
Layout snapshots are captured along with every gesture click event with throttling (750ms between consecutive
snapshots). This ensures that you get a representative snapshot of the UI without overwhelming the system with too many
images. The snapshots are stored in a compressed lightweight format, which is efficient for both storage and rendering.
### Flutter
Layout snapshots are collected by default for Flutter applications. However, only the widgets shown in the table are
used to build the layout snapshot. To make the layout snapshot more useful, you can use a build time script to also
add any other widgets that are used in your application.
See [measure_build](https://measure.sh/docs/../../flutter/packages/measure_build) package for more details.
| Default Widget Types |
|-------------------------|
| `FilledButton` |
| `OutlinedButton` |
| `TextButton` |
| `ElevatedButton` |
| `CupertinoButton` |
| `ButtonStyleButton` |
| `MaterialButton` |
| `IconButton` |
| `FloatingActionButton` |
| `ListTile` |
| `PopupMenuButton` |
| `PopupMenuItem` |
| `DropdownButton` |
| `DropdownMenuItem` |
| `ExpansionTile` |
| `Card` |
| `Scaffold` |
| `CupertinoPageScaffold` |
| `MaterialApp` |
| `CupertinoApp` |
| `Container` |
| `Row` |
| `Column` |
| `ListView` |
| `PageView` |
| `SingleChildScrollView` |
| `ScrollView` |
| `Text` |
| `RichText` |
## How it works
### Android
When Measure SDK is initialized, it registers a touch event interceptor using
the [Curtains library](https://github.com/square/curtains?tab=readme-ov-file#curtainskt). It allows Measure to
intercept every touch event in an application and process it.
There are two main parts to tracking gestures:
1. [Gesture detection](#gesture-detection)
2. [Gesture target detection](#gesture-target-detection)
#### Gesture detection
Measure tracks the time between `ACTION_DOWN` and `ACTION_UP` events and the distance moved to classify a touch as
click, long click or scroll.
A gesture is classified as a long click gesture if the time interval between `ACTION_DOWN` and `ACTION_UP` is more
than [ViewConfiguration.getLongPressTimeout](https://developer.android.com/reference/android/view/ViewConfiguration#getLongPressTimeout())
time and the distance moved by the pointer between the two events is
less
than [ViewConfiguration.get.getScaledTouchSlop](https://developer.android.com/reference/android/view/ViewConfiguration#getScaledTouchSlop()).
A gesture is classified as a click if the distance moved by the pointer between the two events is
less
than [ViewConfiguration.get.getScaledTouchSlop](https://developer.android.com/reference/android/view/ViewConfiguration#getScaledTouchSlop())
but the time interval between the two events is less
than [ViewConfiguration.getLongPressTimeout()](https://developer.android.com/reference/android/view/ViewConfiguration#getLongPressTimeout()).
A gesture is classified as a scroll if the distance moved by the pointer between the two events is more than
[ViewConfiguration.get.scaledTouchSlop](https://developer.android.com/reference/android/view/ViewConfiguration#getScaledTouchSlop()).
An estimation of direction in which the scroll happened based on the pointer movement.
**For compose**, a click/long click is detected by traversing the semantics tree
using [SemanticsOwner.getAllSemanticsNodes](https://developer.android.com/reference/kotlin/androidx/compose/ui/semantics/SemanticsOwner#(androidx.compose.ui.semantics.SemanticsOwner).getAllSemanticsNodes(kotlin.Boolean,kotlin.Boolean))
and finding a composable at the point where the touch happened and checking for Semantics Properties -
SemanticsActions.OnClick, SemanticsActions.OnLongClick and SemanticsActions.ScrollBy
for click, long click and scroll respectively.
> [!NOTE]
>
> Compose currently reports the target_id in the collected data using [testTag](https://developer.android.com/reference/kotlin/androidx/compose/ui/semantics/package-summary#(androidx.compose.ui.semantics.SemanticsPropertyReceiver).testTag()),
> if it is set. While the `target` is always reported as `AndroidComposeView`.
#### Gesture target detection
Along with the type of gesture which occurred, Measure can also **estimate** the target view/composable on which the
gesture was performed on.
For a click/long click, a hit test is performed to check the views which are under the point where the touch occurred. A
traversal is performed on the children of the view group found and is checked for any view which has
either [isClickable](https://developer.android.com/reference/android/view/View#isClickable())
or [isPressed](https://developer.android.com/reference/android/view/View#isPressed()) set to true. If one is found, it
is returned as the target, otherwise, the touch is discarded as can be classified as a "dead click".
Similarly, for a scroll, after the hit test, a traversal is performed for any view which
has [isScrollContainer](https://developer.android.com/reference/android/view/View#isScrollContainer()) set to
true and [canScrollVertically](https://developer.android.com/reference/android/view/View#canScrollVertically(int))
or [canScrollHorizontally](https://developer.android.com/reference/android/view/View#canScrollHorizontally(int)). If a
view which satisfies this condition it is returned as the target, otherwise, the scroll is discarded and can be
classified as a "dead scroll".
Gesture tracking consists of two main components:
1. [Gesture detection](#gesture-detection)
2. [Gesture target detection](#gesture-target-detection)
### iOS
#### Gesture detection
Measure SDK detects touch events by swizzling `UIWindow`'s `sendEvent` method. It processes touch events to classify
them into different gesture types:
- **Click**: A touch event that lasts for less than 500 ms.
- **Long Click**: A touch event that lasts for more than 500 ms.
- **Scroll**: A touch movement exceeding 3.5 points in any direction.
#### Gesture target detection
Gesture target detection identifies the UI element interacted with during a gesture. It first determines the view at the
touch location and then searches its subviews to find the most relevant target. For scroll detection, it checks if the
interacted element is a scrollable view like `UIScrollView`, `UIDatePicker` or `UIPickerView`.
### Flutter
#### Gesture detection
Measure SDK detects touch events by listening to pointer events
from [Listener](https://api.flutter.dev/flutter/widgets/Listener-class.html) widget, which is
added to the root widget of the app using `MeasureWidget`.
It processes touch events to classify them into different gesture types:
- **Click**: A touch event that lasts for less than 500 ms.
- **Long Click**: A touch event that lasts for more than 500 ms.
- **Scroll**: A touch movement exceeding 20 pixels in any direction.
#### Gesture target detection
The SDK automatically identifies gesture targets by traversing the widget tree and checking if
widgets at the touch position are interactive. For clicks and long clicks, it searches for clickable
widgets, while for scrolls, it looks for scrollable widgets.
> [!NOTE]
> Any widget not listed in the tables below will not be automatically tracked for
> gestures. For custom widgets or unsupported widget types, gestures will not be detected unless they
> inherit from or contain one of the supported widget types.
**Supported Clickable Widgets:**
| Widget Type |
|------------------------|
| `ButtonStyleButton` |
| `MaterialButton` |
| `IconButton` |
| `FloatingActionButton` |
| `CupertinoButton` |
| `ListTile` |
| `PopupMenuButton` |
| `PopupMenuItem` |
| `DropdownButton` |
| `DropdownMenuItem` |
| `ExpansionTile` |
| `Card` |
| `GestureDetector` |
| `InputChip` |
| `ActionChip` |
| `FilterChip` |
| `ChoiceChip` |
| `Checkbox` |
| `Switch` |
| `Radio` |
| `CupertinoSwitch` |
| `CheckboxListTile` |
| `SwitchListTile` |
| `RadioListTile` |
| `TextField` |
| `TextFormField` |
| `CupertinoTextField` |
| `Stepper` |
**Supported Scrollable Widgets:**
| Widget Type |
|-------------------------|
| `ListView` |
| `ScrollView` |
| `PageView` |
| `SingleChildScrollView` |
### Layout snapshots
Layout snapshots capture your app's UI structure by traversing the widget tree from the root widget. The SDK collects
key information about each widget—including its type, position, size and hierarchy—to build a lightweight
representation of your UI.
The entire layout snapshot is generated in a single pass through the widget tree using the `visitChildElements` method.
Since a typical Flutter screen can contain thousands of widgets, the snapshot is optimized to include only relevant
widget types to maintain performance and clarity.
To include custom widgets or additional widget types in your snapshots, use
the [measure_build](https://measure.sh/docs/../../flutter/packages/measure_build) package to generate a comprehensive list of all
widget types used in your app.
### React Native
Gesture detection for React Native apps are based on the platform the app is running on (Android or iOS). The SDK uses the same methods as described above for Android and iOS.
## Benchmark results
### Android
Checkout the results from a macro benchmark we ran for gesture target
detection [here](https://github.com/measure-sh/measure/pull/377#issue-2123559330).
TLDR;
* On average, it takes 0.458 ms to find the clicked view in a deep view hierarchy.
* On average, it takes 0.658 ms to find the clicked composable in a deep composable hierarchy.
### iOS
- On average, it takes **4 ms** to identify the clicked view in a view hierarchy with a depth of **1,500**.
- For more common scenarios, a view hierarchy with a depth of **20** takes approximately **0.2 ms**.
### Flutter
- On average, it takes **3ms** to generate a layout snapshot and identify the clicked widget in a widget tree with a
depth of **50** widgets.
- The time to generate the layout snapshot increases linearly with the depth of the widget tree.
- The benchmark tests can be found in [Layout Snapshot Perf Tests](../../flutter/example/integration_test/layout_snapshot_performance_test.dart).
### Flutter
- On average, it takes **10ms** to generate a layout snapshot and identify the clicked widget in a widget tree with a
depth of **100** widgets.
- The time to generate the layout snapshot increases linearly with the depth of the widget tree.
- The benchmark tests can be found [here](../../flutter/example/integration_test/layout_snapshot_performance_test.dart).
---
Source: https://measure.sh/docs/features/feature-performance-tracing
---
# Performance Tracing
* [**Introduction**](#introduction)
* [**Concepts**](#concepts)
* [**API Reference**](#api-reference)
* [Limits](#limits)
* [Start a Span](#start-a-span)
* [End a Span](#end-a-span)
* [Set Parent Span](#set-parent-span)
* [Set Attributes](#set-attributes)
* [Remove Attribute](#remove-attribute)
* [Update Span Name](#update-span-name)
* [Add Checkpoint](#add-checkpoint)
* [Deferred Span Start](#deferred-span-start)
* [Distributed Tracing](#distributed-tracing)
* [Get a Trace Parent Header](#get-a-trace-parent-header)
* [**Recipes**](#recipes)
* [Distributed Tracing with OkHttp Interceptor](#distributed-tracing-with-okhttp-interceptor)
* [Distributed Tracing with URLSession Interceptor](#distributed-tracing-with-urlsession-interceptor)
* [**Screen Load Time**](#screen-load-time)
* [Android](#android)
* [How It Works](#how-it-works)
* [Data Captured](#data-captured)
* [Spans Visualized Using Perfetto](#spans-visualized-using-perfetto)
* [iOS](#ios)
* [How It Works](#how-it-works-1)
* [Data Captured](#data-captured-1)
## Introduction
You can easily track the performance of any part of your application, such as API calls, DB queries, any function or a user journey, using the performance tracing APIs. The SDK supports nested spans to track hierarchical operations.
> [!NOTE]
>
> measure-sh can automatically track traces for screen load times in Android and iOS apps for _Activities_, _Fragments_ and _UIViewControllers_. See [Screen Load Time](#screen-load-time) for more details.
Here's a simple example of how to use the performance tracing APIs:
Android
```kotlin
val onboardingSpan = Measure.startSpan("onboarding-flow")
try {
val signupSpan = Measure.startSpan("signup", parent = onboardingSpan)
userSignup()
signupSpan.end()
val tutorialSpan = Measure.startSpan("tutorial", parent = onboardingSpan)
showTutorial()
tutorialSpan.end(SpanStatus.Ok)
} finally {
onboardingSpan.end(SpanStatus.Error)
}
```
iOS
```swift
let onboardingSpan: Span = Measure.startSpan(name: "onboarding-flow")
do {
let signupSpan = Measure.startSpan(name: "signup").setParent(onboardingSpan)
userSignup()
signupSpan.end()
let tutorialSpan = Measure.startSpan(name: "tutorial").setParent(onboardingSpan)
showTutorial()
tutorialSpan.end(status: .ok)
} catch {
onboardingSpan.end(status: .error)
}
```
Flutter
```dart
final onboardingSpan = Measure.instance.startSpan("onboarding-flow");
try {
final signupSpan = Measure.instance
.startSpan("signup")
.setParent(onboardingSpan);
await userSignup();
signupSpan.end();
final tutorialSpan = Measure.instance
.startSpan("tutorial")
.setParent(onboardingSpan);
await showTutorial();
tutorialSpan.end(status: SpanStatus.ok);
} catch (e) {
onboardingSpan.end(status: SpanStatus.error);
} finally {
onboardingSpan.end();
}
```
React Native
```typescript
import { Measure } from '@measuresh/react-native';
const onboardingSpan = Measure.startSpan({ name: "onboarding-flow" });
try {
const signupSpan = Measure.startSpan({ name: "signup" }).setParent(onboardingSpan);
await userSignup();
signupSpan.end();
const tutorialSpan = Measure.startSpan({ name: "tutorial" }).setParent(onboardingSpan);
await showTutorial();
tutorialSpan.end();
} catch (e) {
onboardingSpan.setAttribute("error", true);
} finally {
onboardingSpan.end();
}
```
This will result in a trace like the following:
```
onboarding-flow ━━━━━━━━━━━━━━━━━━━━━━━━━━━━━━━━━━━━ [2.4s] ✓
┃
┣━ signup ━━━━━━━━━ [800ms] ✓
┃
┗━ tutorial ━━━━━━━━━━━━━━━━ [1.6s] ✓
```
## Concepts
Tracing helps you understand how long certain operations take to complete, from the moment they begin until they finish, including all the intermediate steps, dependencies and parallel activities that occur during execution.
A **trace** represents the entire operation, which could be a complete user journey like onboarding, further divided into multiple steps like login, create profile, etc. A trace is represented by a `trace_id`.
A **span** is the fundamental building block of a trace. A span represents a single unit of work. This could be an HTTP request, a database query, a function call, etc. Each span contains information about the operation — when it started, how long it took and whether it completed successfully or not. A span is identified using a `span_id` and a user-defined `name`.
Each span can optionally have a **parent span**, which allows you to create a hierarchy of spans. This is useful for tracking nested operations. For example, if a user journey involves multiple steps, each step can be represented as a child span of the main user journey span.

## API Reference
### Limits
The following limits apply to spans. Spans violating the limits will either be discarded or have their data truncated.
| | Limit |
|----------------------------|-------|
| Max Span Name Length | 64 |
| Max Checkpoint Name Length | 64 |
| Max Checkpoints Per Span | 100 |
### Start a Span
A span can be started using the `startSpan` function.
Android
```kotlin
val span: Span = Measure.startSpan("span-name")
```
iOS
```swift
let span: Span = Measure.startSpan(name: "span-name")
```
Flutter
```dart
final span = Measure.instance.startSpan("span-name");
```
React Native
```typescript
const span = Measure.startSpan({ name: "span-name" });
```
A span can also be started by providing the start time, this is useful in cases where a certain
operation has already started but there wasn't any way to access the Measure APIs in that part of the code.
> [!IMPORTANT]
> To set the start time, use `Measure.getCurrentTime`, which returns epoch time calculated using a
> monotonic clock.
> Passing in `System.currentTimeInMillis` can lead to issues with corrupted span timings due to
> clock skew issues.
Android
```kotlin
val span: Span = Measure.startSpan("span-name", timestamp = Measure.getCurrentTime())
```
iOS
```swift
let span: Span = Measure.startSpan(name: "operation-name", timestamp: Measure.getCurrentTime())
```
Flutter
```dart
final span = Measure.instance.startSpan("span-name", timestamp: Measure.instance.getCurrentTime());
```
React Native
```typescript
const span = Measure.startSpanWithTimestamp({ name: "span-name", timestampMs: Measure.getCurrentTime() });
```
### End a Span
A span can be ended using the `end` function. Status is mandatory to set when ending a span.
Android
```kotlin
val span: Span = Measure.startSpan("span-name")
span.setStatus(SpanStatus.Ok).end()
```
iOS
```swift
let span: Span = Measure.startSpan(name: "span-name")
span.setStatus(.ok).end()
```
Flutter
```dart
final span = Measure.instance.startSpan("span-name");
span.setStatus(SpanStatus.ok).end();
```
React Native
```typescript
const span = Measure.startSpan({ name: "span-name" });
span.end();
```
A span can also be ended by providing the end time, this is useful in cases where a certain
operation has already ended
but there wasn't any way to access the Measure APIs in that part of the code.
> [!IMPORTANT]
> To set the end time, use `Measure.getCurrentTime`, which returns epoch time calculated using a
> monotonic clock.
> Passing in `System.currentTimeInMillis` can lead to issues with corrupted span timings due to
> clock skew issues.
Android
```kotlin
val span: Span = Measure.startSpan("span-name")
span.setStatus(SpanStatus.Ok).end(timestamp = Measure.getCurrentTime())
```
iOS
```swift
let span: Span = Measure.startSpan(name: "span-name")
span.setStatus(.ok).end(timestamp: Measure.getCurrentTime())
```
Flutter
```dart
final span = Measure.instance.startSpan("span-name");
span.setStatus(SpanStatus.ok).end(timestamp: Measure.instance.getCurrentTime());
```
React Native
```typescript
const span = Measure.startSpan({ name: "span-name" });
span.end(Measure.getCurrentTime());
```
### Set Parent Span
To set a parent span, use the `setParent` method.
Android
```kotlin
val parentSpan: Span = Measure.startSpan("parent-span")
val childSpan: Span = Measure.startSpan("child-span").setParent(parentSpan)
```
iOS
```swift
let parentSpan: Span = Measure.startSpan(name: "parent-span")
let childSpan: Span = Measure.startSpan(name: "child-span").setParent(parentSpan)
```
Flutter
```dart
final parentSpan = Measure.instance.startSpan("parent-span");
final childSpan = Measure.instance.startSpan("child-span").setParent(parentSpan);
```
React Native
```typescript
const parentSpan = Measure.startSpan({ name: "parent-span" });
const childSpan = Measure.startSpan({ name: "child-span" }).setParent(parentSpan);
```
### Set Attributes
Attributes are key-value pairs that can be attached to a span. Attributes are used to add additional context to a span.
> [!NOTE]
> - Attribute keys must be strings with a maximum length of `256` characters.
> - Attribute keys must only contain alphabets, numbers, hyphens and underscores.
> - Attribute values must be one of the primitive types: `int`, `long`, `double`, `float` or `boolean`.
> - String attribute values can have a maximum length of `256` characters.
To add attributes to a span, use `setAttribute`.
Android
```kotlin
val span: Span = Measure.startSpan("span-name")
span.setAttribute("key", "value")
```
iOS
```swift
let span: Span = Measure.startSpan(name: "span-name")
span.setAttribute("key", "value")
```
Flutter
```dart
final span = Measure.instance.startSpan("span-name");
span.setAttributeString("key", "value");
span.setAttributeInt("key", 10);
span.setAttributeDouble("key", 10.5);
span.setAttributeBool("key", true);
```
React Native
```typescript
const span = Measure.startSpan({ name: "span-name" });
span.setAttribute("key", "value");
span.setAttribute("count", 10);
span.setAttribute("enabled", true);
```
To add multiple attributes at once use `setAttributes`.
Android
```kotlin
val span: Span = Measure.startSpan("span-name")
val attributes = AttributesBuilder().put("key", "value").put("key2", "value2").build()
span.setAttributes(attributes)
```
iOS
```swift
let span: Span = Measure.startSpan(name: "span-name")
let attributes: [String: AttributeValue] = ["key": "value", "key2": 42]
span.setAttributes(attributes)
```
Flutter
```dart
final span = Measure.instance.startSpan("span-name");
final attributes = AttributeBuilder().add("key", "value").add("key2", 42).build();
span.setAttributes(attributes);
```
React Native
```typescript
const span = Measure.startSpan({ name: "span-name" });
span.setAttributes({ key: "value", key2: 42, enabled: true });
```
### Remove Attribute
To remove an attribute use `removeAttribute`.
Android
```kotlin
val span: Span = Measure.startSpan("span-name")
span.removeAttribute("key")
```
iOS
```swift
let span: Span = Measure.startSpan(name: "span-name")
span.removeAttribute("key")
```
Flutter
```dart
final span = Measure.instance.startSpan("span-name");
span.removeAttribute("key");
```
React Native
```typescript
const span = Measure.startSpan({ name: "span-name" });
span.removeAttribute("key");
```
### Update Span Name
To update the name of the span after it is started, use `setName`.
Android
```kotlin
val span: Span = Measure.startSpan("span-name")
span.setName("updated-name").end()
```
iOS
```swift
let span: Span = Measure.startSpan(name: "span-name")
span.setName("updated-name").end()
```
Flutter
```dart
final span = Measure.instance.startSpan("span-name");
span.setName("updated-name").end();
```
React Native
```typescript
const span = Measure.startSpan({ name: "span-name" });
span.setName("updated-name").end();
```
### Add Checkpoint
To add a checkpoint use `setCheckpoint`.
Android
```kotlin
val span: Span = Measure.startSpan("span-name").setCheckpoint("checkpoint-name")
```
iOS
```swift
let span: Span = Measure.startSpan(name: "span-name").setCheckpoint("checkpoint-name")
```
Flutter
```dart
final span = Measure.instance.startSpan("span-name").setCheckpoint("checkpoint-name");
```
React Native
```typescript
const span = Measure.startSpan({ name: "span-name" }).setCheckpoint("checkpoint-name");
```
### Deferred Span Start
The span builder API allows pre-configuring a span without starting it immediately.
Android
```kotlin
val spanBuilder: SpanBuilder = Measure.createSpan("span-name")
val span: Span = spanBuilder.startSpan()
```
iOS
```swift
let spanBuilder: SpanBuilder = Measure.createSpanBuilder(name: "span-name")!
let span: Span = spanBuilder.startSpan()
```
Flutter
```dart
final spanBuilder = Measure.instance.createSpanBuilder("span-name");
final span = spanBuilder.startSpan();
```
React Native
```typescript
const spanBuilder = Measure.createSpanBuilder({ name: "span-name" });
const span = spanBuilder?.startSpan();
```
## Distributed Tracing
Distributed tracing is a monitoring method that helps tracking requests as they travel through
different services in a distributed system (like microservices, serverless functions and mobile
apps).
The `traceparent` header is a key component of distributed tracing that helps track requests as they
flow through
different services. It follows
the [W3C Trace Context specification](https://www.w3.org/TR/trace-context/#header-name)
and consists of four parts in a single string:
Example: `00-4bf92f3577b34da6a3ce929d0e0e4736-00f067aa0ba902b7-01`
Where:
* `00`: Version
* `4bf92f3577b34da6a3ce929d0e0e4736`: Globally unique trace ID
* `00f067aa0ba902b7`: Parent span ID (representing the current operation)
* `01`: Trace flags (like whether sampling is enabled)
When your mobile app makes API calls, including this header allows you to correlate the client-side
operations with
server-side processing, giving you end-to-end visibility of your request flow.
### Get a trace parent header
Android
```kotlin
val span = Measure.startSpan("http")
val key = Measure.getTraceParentHeaderKey()
val value = Measure.getTraceParentHeaderValue(span)
```
iOS
```swift
let span = Measure.startSpan(name: "http")
let key = Measure.getTraceParentHeaderKey()
let value = Measure.getTraceParentHeaderValue(span: span)
```
Flutter
```dart
final span = Measure.instance.startSpan("http");
final key = Measure.instance.getTraceParentHeaderKey();
final value = Measure.instance.getTraceParentHeaderValue(span);
```
React Native
```typescript
const span = Measure.startSpan({ name: "http" });
const key = Measure.getTraceParentHeaderKey();
const value = Measure.getTraceParentHeaderValue({ span });
```
## Sampling
See [Configuration Options](https://measure.sh/docs/configuration-options) for details on how to configure sampling for performance traces.
## Recipes
### Distributed Tracing with OkHttp Interceptor
```kotlin
// First, create an interceptor to handle tracing
class TracingInterceptor : Interceptor {
override fun intercept(chain: Interceptor.Chain): Response {
val span = Measure.startSpan("http")
try {
// Add traceparent header to the request
val originalRequest = chain.request()
val tracedRequest = originalRequest.newBuilder()
.header(
Measure.getTraceParentHeaderKey(),
Measure.getTraceParentHeaderValue(span)
)
.build()
// Execute the request
val response = chain.proceed(tracedRequest)
// Set span status based on response
if (response.isSuccessful) {
span.setStatus(SpanStatus.Ok)
} else {
span.setStatus(SpanStatus.Error)
}
return response
} finally {
span.end()
}
}
}
// Set up OkHttp client with the interceptor
val okHttpClient = OkHttpClient.Builder()
.addInterceptor(TracingInterceptor())
.build()
```
### Distributed Tracing with URLSession Interceptor
```swift
// Create a URLSession interceptor to handle tracing
class TracingInterceptor: NSObject, URLSessionTaskDelegate {
func urlSession(_ session: URLSession, task: URLSessionTask, willPerformHTTPRedirection response: HTTPURLResponse, newRequest request: URLRequest, completionHandler: @escaping (URLRequest?) -> Void) {
let span = Measure.startSpan(name: "http")
var tracedRequest = request
tracedRequest.addValue(
Measure.getTraceParentHeaderValue(span: span),
forHTTPHeaderField: Measure.getTraceParentHeaderKey()
)
completionHandler(tracedRequest)
span.setStatus(.ok).end()
}
}
// Set up URLSession with the interceptor
let session = URLSession(configuration: .default, delegate: TracingInterceptor(), delegateQueue: nil)
```
h3: ### Distributed Tracing with Dio Interceptor
```dart
class TraceHeaderInterceptor extends Interceptor {
@override
void onRequest(RequestOptions options, RequestInterceptorHandler handler) {
// Start a new span for the HTTP request
final span = Measure.instance.startSpan("http");
// Get the trace parent header key and value
final key = Measure.instance.getTraceParentHeaderKey();
final value = Measure.instance.getTraceParentHeaderValue(span);
// Add the trace header to the request
options.headers[key] = value;
// Store the span in extra data so we can finish it later
options.extra['trace_span'] = span;
super.onRequest(options, handler);
}
@override
void onResponse(Response response, ResponseInterceptorHandler handler) {
final span = response.requestOptions.extra['trace_span'];
span?.end();
super.onResponse(response, handler);
}
@override
void onError(DioException err, ErrorInterceptorHandler handler) {
final span = err.requestOptions.extra['trace_span'];
span?.end();
super.onError(err, handler);
}
}
```
### Distributed Tracing with React Native fetch
```typescript
import { Measure } from '@measuresh/react-native';
async function trackedFetch(url: string, options?: RequestInit) {
const span = Measure.startSpan({ name: "http" });
const headers: Record = {
...(options?.headers as Record),
[Measure.getTraceParentHeaderKey()]: Measure.getTraceParentHeaderValue({ span }),
};
try {
const response = await fetch(url, { ...options, headers });
span.end();
return response;
} catch (error) {
span.setAttribute("error", true).end();
throw error;
}
}
```
## Screen Load Time
Time taken to load an Activity/Fragment in Android or a UIViewController in iOS is automatically tracked using a trace.
### Android
**Activity load time** measures the time between the Activity being created and the first
frame drawn on the screen. This is also known as Time to First Frame or
Time to Initial Display (TTID).
Each Activity load time is captured using a unique span with the name `Activity TTID` followed
by the fully qualified class name of the Activity. For example, for `MainActivity` the span
name would be `Activity TTID com.example.MainActivity`.
An attribute called `app_startup_first_activity` with value of _true_ is automatically added to the span to indicate
if the Activity was being loaded as part of a [cold](https://measure.sh/docs/feature-app-launch-metrics) launch.
**Fragment load time** measures the time between the Fragment view being created and the
first frame drawn on the screen.
This is also known as Time to First Frame (TTF) or Time to Initial Display (TTID).
Each Fragment load time is captured using a unique span with the name `Fragment TTID` followed
by the fully qualified class name of the Fragment. For example, for `HomeFragment` the span
name would be `Fragment TTID com.example.HomeFragment`.
A large TTID means users wait too long to see content while navigating the app.
> Note that the fully qualified activity name may be truncated to fit within the 64 character limits for span names.
#### How it works
**Activity load time** a span starts in the `onCreate` callback of the Activity. The span ends
when the first frame is drawn on the screen. This is achieved using two techniques:
1. Attach a `View.addOnAttachStateChangeListener` to the root view of the Activity to detect when the view is attached to the window.
2. Post a runnable using `Handler.sendMessageAtFrontOfQueue` on the main thread as a proxy for detecting when the first frame is drawn.
#### Data Captured
A span with the name `Activity TTID {fully qualified activity name}` is created for each Activity load. And a span with the name `Fragment TTID {fully qualified fragment name}` is created for each Fragment load.
The Activity TTID span may have the following attributes if applicable:
| Attribute | Description |
|----------------------------|------------------------------------------------------------------|
| app_startup_first_activity | Whether this activity is the first activity launched in the app. |
The spans have the following checkpoints:
| Checkpoint | Description |
|-----------------------------|------------------------------------------|
| fragment_lifecycle_attached | The time when the Fragment was attached. |
| fragment_lifecycle_started | The time when the Fragment was started. |
| fragment_lifecycle_resumed | The time when the Fragment was resumed. |
| activity_lifecycle_created | The time when the Activity was created. |
| activity_lifecycle_started | The time when the Activity was started. |
| activity_lifecycle_resumed | The time when the Activity was resumed. |
#### Spans Visualized Using Perfetto
The following image shows TTID spans of an Activity along with its two Fragments visualized using Perfetto.

### iOS
**ViewController load time** measures the time between the ViewController's view being loaded and the first frame drawn on the screen. This is also known as Time to First Frame or Time to Initial Display (TTID).
Each ViewController load time is captured using a unique span with the name `VC TTID` followed by the fully qualified class name of the ViewController. For example, for `MainViewController` the span name would be `VC TTID MainViewController`.
An attribute called `app_startup_first_view_controller` with a value of _true_ is automatically added to the span to indicate if the ViewController was being loaded as part of a cold launch.
A large TTID means users wait too long to see content while navigating the app.
> Note that the fully qualified ViewController name may be truncated to fit within the 64 character limits for span names.
#### How It Works
**ViewController load time** tracking works by monitoring the ViewController's lifecycle events:
1. The span starts in either the `loadView` or `viewDidLoad` callback of the ViewController:
- If you inherit from `MsrViewController` (Swift) or `MSRViewController` (Objective-C), the span will start from `loadView`.
- Otherwise, the span will start from `viewDidLoad`.
2. The span ends when `viewDidAppear` is called, indicating that the view is fully visible on screen.
The SDK uses method swizzling to automatically track these lifecycle events without requiring any manual instrumentation.
#### Data Captured
A span with the name `VC TTID {view controller name}` is created for each ViewController load.
The ViewController TTID span may have the following attributes if applicable:
| Attribute | Description |
|-----------------------------------|--------------------------------------------------------------------|
| app_startup_first_view_controller | Whether this view controller is the first one launched in the app. |
The spans have the following checkpoints:
| Checkpoint | Description |
|---------------------|------------------------------------------------|
| vc_load_view | The time when the view was loaded. |
| vc_view_did_load | The time when the view was loaded into memory. |
| vc_view_will_appear | The time when the view is about to appear. |
| vc_view_did_appear | The time when the view is fully visible. |
---
Source: https://measure.sh/docs/features/feature-custom-events
---
# Track Custom Events
* [**Introduction**](#introduction)
* [**Custom Events in Session Timeline**](#custom-events-in-session-timeline)
* [**API Reference**](#api-reference)
* [**Track a Custom Event**](#track-a-custom-event)
* [**Custom Event Attributes**](#custom-event-attributes)
* [**Custom Event with Timestamp**](#custom-event-with-timestamp)
* [**React Native**](#react-native)
## Introduction
Custom events let you add your own context on top of the automatically collected events. They’re great for tracking things that matter to your app, like user actions, feature usage, feature flags or any other domain-specific data. This helps you debug issues more effectively and analyze the real-world impact of your features.
> [!TIP]
>
> Some events like Screen View and Handled errors/exceptions can be tracked using dedicated methods. This allows you to maintain a consistent structure for common events, making them easier to search and analyze.
## Custom Events in Session Timeline
Custom events are included in the [Session Timeline](https://measure.sh/docs/feature-session-timelines) along with other automatically collected events. The event and its attributes can be viewed in the timeline, making it easy to get context on what happened during a session.
## API Reference
### Track a Custom Event
To track a custom event, use the `trackEvent` method.
#### Android
```kotlin
Measure.trackEvent("event_name")
```
#### iOS
Using Swift:
```swift
Measure.trackEvent(name: "event_name")
```
Using ObjC:
```objc
[Measure trackEvent:@"event_name"];
```
#### Flutter
```dart
Measure.instance.trackEvent(name: "event_name");
```
### Custom Event Attributes
A custom event can also contain attributes, which are key-value pairs.
> [!NOTE]
> - Attribute keys must be strings with a maximum length of `256` characters.
> - Attribute keys must only contain alphabets, numbers, hyphens and underscores.
> - Attribute values must be one of the primitive types: `int`, `long`, `double`, `float` or `boolean`.
> - String attribute values can have a maximum length of `256` characters.
#### Android
```kotlin
val attributes = AttributesBuilder()
.put("is_premium_user", true)
.build()
Measure.trackEvent("event_name", attributes = attributes)
```
#### iOS
Using Swift:
```swift
Measure.trackEvent(name: "event_name", attributes: ["is_premium_user": .bool(true)])
```
Using ObjC:
```objc
[Measure trackEvent:@"event_name" attributes:@{@"is_premium_user": YES}];
```
#### Flutter
```dart
final attributes = AttributeBuilder()
.add("is_premium_user", true)
.build();
Measure.instance.trackEvent(name: "event_name", attributes: attributes);
```
### Custom Event with Timestamp
You can also record a custom event with a specific timestamp. This is useful for tracking events that happened before the SDK was initialized, like events during app startup. The timestamp should be in milliseconds since epoch.
#### Android
```kotlin
Measure.trackEvent("event_name", timestamp = 1734443973879L)
```
#### iOS
Using Swift:
```swift
Measure.trackEvent(name: "event_name", timestamp: 1734443973879)
```
Using ObjC:
```objc
[Measure trackEvent:@"event_name" timestamp:1734443973879];
```
#### Flutter
```dart
Measure.instance.trackEvent(name: "event_name", timestamp: 1734443973879);
```
## React Native
To track a custom event:
```typescript
import { Measure } from '@measuresh/react-native';
Measure.trackEvent({ name: "event_name" });
```
To include attributes:
```typescript
Measure.trackEvent({
name: "event_name",
attributes: {
is_premium_user: true,
screen: "Home",
retry_count: 2,
},
});
```
To record a custom event with a specific timestamp, pass the timestamp in milliseconds since epoch.
Use `Measure.getCurrentTime()` to get an accurate timestamp from a monotonic clock.
```typescript
const timestamp = Measure.getCurrentTime();
Measure.trackEvent({ name: "event_name", timestamp });
```
---
Source: https://measure.sh/docs/features/feature-bug-report-android
---
# Bug Reports — Android
Bug reports enable users to report issues directly from the app. Measure SDK provides two approaches to implement bug reporting.
* [Session Timeline](#session-timeline)
* [Built-in Experience](#built-in-experience)
* [Theming](#theming)
* [Permissions](#permissions)
* [Custom Experience](#custom-experience)
* [Attachments](#attachments)
* [Capture Screenshot](#capture-screenshot)
* [Capture Layout Snapshot](#capture-layout-snapshot)
* [Add Image from Gallery](#add-image-from-gallery)
* [Limits](#limits)
* [Add Attributes](#add-attributes)
* [Shake to Report Bug](#shake-to-report-bug)
* [Benchmarks](#benchmarks)
## Session Timeline
When a bug report is captured, it automatically comes with a session timeline that includes all events that occurred 5
minutes before the bug report was submitted. This provides rich context to help diagnose and fix the reported issue.
## Built-in Experience
Launch the default bug report interface using `Measure.launchBugReportActivity`. A screenshot is automatically taken when this method is called and added to the bug report. Users can choose to remove the screenshot if they wish.
| Dark Mode | Light Mode |
|--------------------------------------------------|----------------------------------------------------|
|  |  |
Usage:
```kotlin
Measure.launchBugReportActivity()
```
To disable taking a screenshot when this method is called, pass in a parameter:
```kotlin
Measure.launchBugReportActivity(takeScreenshot = false)
```
### Theming
You can apply a custom theme by overriding any of the values in the theme: [themes.xml](https://github.com/measure-sh/measure/tree/main/android/measure-android/measure/src/main/res/values/themes.xml).
For more details on customizing themes, refer to the Android documentation on [theming](https://developer.android.com/develop/ui/views/theming/themes#CustomizeTheme).
### Permissions
Users can add images from gallery to report bugs. We rely on
the `androidx-activity` [photo picker](https://developer.android.com/training/data-storage/shared/photo-picker#device-availability).
This requires **no additional permissions** to be declared in the app's manifest.
The new photo picker UI is only available on Android 11 (API level 30) and above. For devices running Android 10 (API
level 29) and below, this falls back to using `ACTION_OPEN_DOCUMENT` to select images from the gallery. Optionally, to
achieve a consistent experience across all Android versions, you can follow the instructions in the
official [documentation](https://developer.android.com/training/data-storage/shared/photo-picker#device-availability) to
install a back-ported version of the photo picker.
> [!NOTE]
> If you are using Measure SDK version `0.11.0` or earlier, you'll need the `READ_MEDIA_IMAGES` permission
> to allow users to select images from the gallery. Without this permission, the button to select images
> from gallery will not be visible.
## Custom Experience
You can build a custom experience to match the look and feel of your app. Once the bug report is entered by the user, trigger the `Measure.trackBugReport` method.
```kotlin
// Track the bug report
Measure.trackBugReport(description = "Items from cart disappear after reopening the app")
```
### Attachments
Bug reports can be enhanced with attachments. A maximum of `5` attachments can be added per bug report.
You can add attachments to bug reports in the following ways:
* [Capture Screenshot](#capture-screenshot)
* [Capture Layout Snapshot](#capture-layout-snapshot)
* [Add Image from Gallery](#add-image-from-gallery)
#### Capture Screenshot
Capture a screenshot using `captureScreenshot`. This function must be called from the main thread.
```kotlin
private val attachments = mutableListOf()
Measure.captureScreenshot(activity, onComplete = { attachment ->
attachments.add(attachment)
})
Measure.trackBugReport(
description = "Items from cart disappear after reopening the app",
attachments = attachments
)
```
> [!IMPORTANT]
> For privacy, screenshots can be masked with the same configuration provided during SDK initialization. See all the configuration options [here](https://measure.sh/docs/configuration-options).
#### Capture Layout Snapshot
Capture a layout snapshot using `captureLayoutSnapshot`. This function must be called from the main thread.
```kotlin
private val attachments = mutableListOf()
Measure.captureLayoutSnapshot(activity, onComplete = { attachment ->
attachments.add(attachment)
})
Measure.trackBugReport(
description = "Items from cart disappear after reopening the app",
attachments = attachments
)
```
#### Add Image from Gallery
To add images selected by a user from the gallery, use `imageUriToAttachment` to convert the `Uri` to an `Attachment`.
Ensure the Uri has the `FLAG_GRANT_READ_URI_PERMISSION` permission granted, as shown in the example below.
```kotlin
private val attachments = mutableListOf()
registerForActivityResult(
ActivityResultContracts.GetContent()
) { uri ->
uri?.let {
// Ensure the Uri has this permission to be able to read the image content
context.contentResolver.takePersistableUriPermission(
uri,
Intent.FLAG_GRANT_READ_URI_PERMISSION
)
// This will compress the image and convert it into an attachment
Measure.imageUriToAttachment(context, uri) { attachment ->
attachments.add(attachment)
}
}
}
// Restrict picker to only allow selecting images
.launch("image/*")
Measure.trackBugReport(
description = "Items from cart disappear after reopening the app",
attachments = attachments
)
```
#### Limits
- Each bug report can have a maximum of `5` attachments.
- The bug report description can have a maximum length of `4000` characters.
## Add Attributes
Attributes allow attaching additional contextual data to bug reports. This helps in adding relevant information about the user's state, app configuration or other metadata that can help with debugging.
- Attribute keys must be strings with a maximum length of 256 characters.
- Attribute values must be one of the primitive types: `int`, `long`, `double`, `float` or `boolean`.
- String attribute values can have a maximum length of 256 characters.
Add attributes when the Bug Report Activity is launched:
```kotlin
val attributes = AttributesBuilder().put("is_premium", true).build()
Measure.launchBugReportActivity(takeScreenshot = true, attributes = attributes)
```
or, when `trackBugReport` is called:
```kotlin
val attributes = AttributesBuilder()
.put("is_premium_user", true)
.build()
Measure.trackBugReport(description = "...", attributes = attributes)
```
## Shake to Report Bug
A shake listener can be set up to allow users to report bugs by shaking their device. This is particularly useful for
quickly reporting issues without navigating through the app.
To set up a shake listener, use the `setShakeListener` method. The listener will be triggered when a shake is detected,
use the `launchBugReportActivity` method to open the bug report interface or implement a custom UI.
> [!NOTE]
> The listener can get called multiple times if the device is shaken multiple times in quick succession.
> The `launchBugReportActivity` method handles this by ensuring that the bug report interface is only launched once.
> However, if you implement a custom UI, you may need to handle this logic yourself.
```kotlin
Measure.setShakeListener(object : MsrShakeListener {
override fun onShake() {
val attributes = AttributesBuilder().put("is_premium", true).build()
Measure.launchBugReportActivity(takeScreenshot = true, attributes = attributes)
}
})
```
To disable the shake listener, use:
```kotlin
Measure.setShakeListener(null)
```
## Benchmarks
The bug reporting flow involves loading images from the file system or capturing screenshots, which might lead to increased memory and CPU consumption. The following Perfetto traces can help in debugging any potential bottlenecks:
* `msr-captureScreenshot` — time spent on the main thread to capture and compress a screenshot.
* `msr-loadImageFromFile` — time spent on the main thread to load an image from a file.
* `msr-loadImageFromUri` — time spent on the main thread to load an image from a Uri.
---
Source: https://measure.sh/docs/features/feature-bug-report-ios
---
# Bug Reports — iOS
Bug reports enable users to report issues directly from the app. There are two ways to use the bug reporting feature:
1. **Built-in Experience**: Use the default bug report interface provided by the SDK.
2. **Custom Experience**: Build a custom bug reporting UI and use the SDK to track bug reports programmatically.
Additionally, the SDK supports using shake gestures to launch the bug reporting flow, allowing users to report bugs quickly and easily without having to navigate through the app.
* [**Session Timeline**](#session-timeline)
* [**Built-in Experience**](#built-in-experience)
* [**Theming**](#theming)
* [**Custom Experience**](#custom-experience)
* [**Add Attributes**](#add-attributes)
* [**Shake to Report Bug**](#shake-to-report-bug)
## Session Timeline
When a bug report is captured, it automatically comes with a session timeline that includes all events that occurred 5
minutes before the bug report was submitted. This provides rich context to help diagnose and fix the reported issue.
## Built-in Experience
Launch the default bug report interface using `Measure.launchBugReport`. A screenshot can be automatically taken and added to the bug report. Users can remove or add more attachments in the UI.
| Dark Mode | Light Mode |
|----------------------------------------------|------------------------------------------------|
|  |  |
When the screenshot button is clicked, a floating screenshot and exit button appear. Users can traverse through the app and take screenshots of the relevant screen.
[Bug Report demo](https://github.com/user-attachments/assets/491e685b-e1ae-4c8d-ac36-8f42d73fa3eb)
### Example Usage
```swift
Measure.launchBugReport(takeScreenshot: true)
```
To disable taking a screenshot when launching, set `takeScreenshot: false`:
```swift
Measure.launchBugReport(takeScreenshot: false)
```
You can also pass a custom UI config and attributes:
```swift
let color = BugReportConfig.default.colors.update(isDarkMode: false)
let config = BugReportConfig(colors: color)
let attributes: [String: AttributeValue] = ["user_id": .string("12345")]
Measure.launchBugReport(takeScreenshot: true, bugReportConfig: config, attributes: attributes)
```
Currently, you can have a maximum of 5 attachments and a description length of 4000 characters.
### Theming
You can customize the appearance of the bug report UI using `BugReportConfig`. To set the theme, update the colors using `.update(isDarkMode: ...)` and pass the result to the `BugReportConfig` initializer.
Check out [BugReportConfig](../../ios/Sources/MeasureSDK/Swift/BugReport/BugReportConfig/) to see all the configurable tokens.
### Example Usage
```swift
let color = BugReportConfig.default.colors.update(isDarkMode: false)
let dimensions = MsrDimensions(
topPadding: 20
)
let config = BugReportConfig(colors: color, dimensions: dimensions)
Measure.launchBugReport(takeScreenshot: true, bugReportConfig: config)
```
## Custom Experience
You can build a custom bug reporting UI and use the SDK to track bug reports programmatically.
### Example Usage
```swift
Measure.captureScreenshot(for: viewController) { screenshot in
Measure.trackBugReport(
description: "Items from cart disappear after reopening the app",
attachments: [screenshot].compactMap { $0 },
attributes: ["is_premium": .bool(true)]
)
}
```
### Attachments
Bug reports can include up to 5 attachments such as screenshots.
### Example Usage
```swift
Measure.captureScreenshot(for: viewController) { screenshot in
guard let screenshot else { return }
Measure.trackBugReport(description: "Bug description", attachments: [screenshot], attributes: nil)
}
```
## Add Attributes
You can attach additional contextual data to bug reports, such as user state or app configuration.
### Example Usage
```swift
let attributes: [String: AttributeValue] = [
"is_premium_user": .bool(true),
"user_id": .string("12345")
]
Measure.launchBugReport(attributes: attributes)
```
Or with custom bug reports:
```swift
Measure.trackBugReport(description: "Bug description", attachments: [], attributes: attributes)
```
## Shake to Report Bug
A shake listener can be set up to allow users to report bugs by shaking their device. This is particularly useful for
quickly reporting issues without navigating through the app.
To set up a shake listener, use the `onShake` method and pass a closure. This closure will be called whenever a shake gesture is detected.
You can either launch the default bug report interface using `launchBugReport`, or implement your own custom UI.
> [!NOTE]
> The listener can get called multiple times if the device is shaken multiple times in quick succession.
> The `launchBugReport` method handles this by ensuring that the bug report interface is only launched once.
> However, if you implement a custom UI, you may need to handle this logic yourself.
```swift
Measure.onShake {
Measure.launchBugReport(takeScreenshot: true, bugReportConfig: BugReportConfig.default, attributes: nil)
}
```
To disable the shake listener, use:
```swift
Measure.onShake(nil)
```
---
Source: https://measure.sh/docs/features/feature-bug-report-flutter
---
# Bug Reports — Flutter
Bug reports enable users to report issues directly from the app. Measure SDK provides two approaches to implement bug reporting.
* [**Session Timeline**](#session-timeline)
* [Built-in Experience](#built-in-experience)
* [Theming](#theming)
* [I18n](#i18n)
* [Custom Experience](#custom-experience)
* [Attachments](#attachments)
* [Limits](#limits)
* [Add Attributes](#add-attributes)
* [Shake to Report Bug](#shake-to-report-bug)
* [Enabled/Disable shake detection](#enabledisable-shake-detection)]
## Session Timeline
When a bug report is captured, it automatically comes with a session timeline that includes all events that occurred 5
minutes before the bug report was submitted. This provides rich context to help diagnose and fix the reported issue.
## Built-in Experience
### iOS
| Dark Mode | Light Mode |
|-------------------------------------------------------|---------------------------------------------------------|
|  |  |
### Android
| Dark Mode | Light Mode |
|----------------------------------------------------------|------------------------------------------------------------|
|  |  |
Launch the default bug report interface by using `Measure.instance.createBugReportWidget` method. Usage:
```dart
final widget = Measure.instance.createBugReportWidget();
```
This is typically launched as a new screen:
```dart
final navigatorState = Navigator.of(context);
navigatorState.push(
MaterialPageRoute(
builder: (context) => Measure.instance.createBugReportWidget(),
settings: const RouteSettings(name: '/msr_bug_report'),
),
);
```
### Adding a screenshot
Include a screenshot when opening the bug report widget. The screenshot is automatically redacted
based on the [screenshot mask level](https://measure.sh/docs/configuration-options) configuration.
```dart
final navigatorState = Navigator.of(context);
final screenshot = await Measure.instance.captureScreenshot();
if (context.mounted) {
navigatorState.push(
MaterialPageRoute(
builder: (context) => Measure.instance.createBugReportWidget(screenshot: screenshot),
settings: const RouteSettings(name: '/msr_bug_report'),
),
);
}
```
### Theming
Override the default primary color for the "Add from Gallery" and "Send" buttons:
Example:
```dart
Measure.instance.createBugReportWidget(
theme: const BugReportTheme(
colors: BugReportColors(
primaryColor: Colors.lightBlue,
),
),
)
```
### I18n
Localize widget text using the BugReportTheme object:
```
Measure.instance.createBugReportWidget(
theme: const BugReportTheme(
text: BugReportText(
appBarTitle: 'your-localized-text',
sendButton: 'your-localized-text',
inputPlaceHolder: 'your-localized-text',
addFromGalleryButton: 'your-localized-text',
),
),
)
```
## Custom Experience
You can build a custom experience to match the look and feel of your app. Once the bug report is entered by the user, trigger the `Measure.trackBugReport` method.
```dart
// Track the bug report
Measure.instance.trackBugReport(
description: "...",
attachments: [],
attributes: {},
);
```
### Attachments
Bug reports can be enhanced with attachments. A maximum of `5` attachments can be added per bug
report. You can add screenshots to bug reports by using the `Measure.captureScreenshot` method.
```dart
final screenshot = await Measure.instance.captureScreenshot();
Measure.instance.trackBugReport(
description: "...",
attachments: [if (screenshot != null) screenshot],
attributes: {},
);
```
### Limits
- Each bug report can have a maximum of `5` attachments.
- The bug report description can have a maximum length of `4000` characters.
## Add Attributes
Attributes allow attaching additional contextual data to bug reports. This helps in adding relevant information about the user's state, app configuration or other metadata that can help with debugging.
- Attribute keys must be strings with a maximum length of 256 characters.
- Attribute values must be one of the primitive types: `int`, `long`, `double`, `float` or `boolean`.
- String attribute values can have a maximum length of 256 characters.
To add attributes, use the optinal `attributes` property in `createBugReportWidget`:
```dart
final attributes = AttributeBuilder().add("order_id", "order-12345").build();
Measure.instance.createBugReportWidget(
attributes: attributes,
);
```
Or add attributes with `trackBugReport` method.
```dart
final attributes = AttributeBuilder().add("order_id", "order-12345").build();
Measure.instance.trackBugReport(
description: "...",
attachments: [],
attributes: attributes,
);
```
## Shake to Report Bug
A shake listener can be set up to allow users to report bugs by shaking their device. This is
particularly useful for quickly reporting issues without navigating through the app.
Use `MsrShakeDetectorMixin` on top level widget in your app if you want to enable shake detection
across the app. Setting up this mixin will automatically enable shake detection and provide
a callback in `onShakeDetected` where you can launch the bug report interface. For example:
```dart
class ShakeExample extends StatefulWidget {
@override
State createState() => _ShakeExampleState();
}
class _ShakeExampleState extends State
with MsrShakeDetectorMixin {
@override
void onShakeDetected() {
_launchBugReport();
}
void _launchBugReport() async {
final screenshot = await Measure.instance.captureScreenshot();
Navigator.of(context).push(
MaterialPageRoute(
builder: (context) => Measure.instance.createBugReportWidget(
screenshot: screenshot,
),
),
);
}
@override
Widget build(BuildContext context) {
return Scaffold(
body: Center(
child: Text('Shake device to report bug'),
),
);
}
}
```
### Enable/Disable shake detection
To conditionally enable/disable shake detection call `disableShakeDetection` and
`enableShakeDetection` methods available in the mixin.
---
Source: https://measure.sh/docs/features/feature-screenshot-masking-swiftui
---
# Screenshot Masking for SwiftUI
Measure's screenshot masking works by traversing the UIKit view hierarchy to identify and redact
sensitive views. Because SwiftUI renders its views differently from UIKit, the standard masking
configuration options behave differently in SwiftUI contexts.
To manage masking in SwiftUI, Measure provides the `.msrMask()` and `.msrUnmask()` view modifiers.
# Table of Contents
* [**How SwiftUI Masking Works**](#how-swiftui-masking-works)
* [**Manual Masking**](#manual-masking)
* [**`.msrMask()`**](#msrmask)
* [**`.msrUnmask()`**](#msrunmask)
* [**Examples**](#examples)
* [**Masking a standalone Text view**](#masking-a-standalone-text-view)
* [**Unmasking content inside a SwiftUI screen**](#unmasking-content-inside-a-swiftui-screen)
* [**Mixed masking in a form**](#mixed-masking-in-a-form)
# How SwiftUI Masking Works
In UIKit, every visible element on screen corresponds to a `UIView` instance in the view hierarchy.
Measure's masking traverses this hierarchy and redacts views that match known sensitive types such
as `UILabel`, `UITextField` and `UITextView`.
SwiftUI does not follow this pattern. Most SwiftUI views do not produce individual `UIView` instances.
Instead, the entire SwiftUI view tree is hosted inside a `_UIHostingView`, which renders its content
directly without creating UIKit counterparts for each view.
As a result, **Measure masks the entire `_UIHostingView` frame by default** when a SwiftUI screen
is present. This is the safest default — it ensures no SwiftUI content leaks into screenshots —
but it means all SwiftUI content is masked, including content that may not be sensitive.
Use `.msrUnmask()` to selectively expose content that is safe to show, and `.msrMask()` to
explicitly mask content that needs to be hidden.
# Manual Masking
## `.msrMask()`
Marks a SwiftUI view as sensitive. The view's frame will be redacted in screenshots regardless of
whether it would be detected automatically.
Use this for:
- Standalone `Text` views containing sensitive data outside of `List` contexts
- Any custom SwiftUI view containing sensitive content that is not automatically detected
```swift
Text(userEmail)
.msrMask()
```
## `.msrUnmask()`
Exempts a SwiftUI view from masking. Use this to opt specific views out of the blanket
`_UIHostingView` masking that is applied by default.
When `.msrUnmask()` is applied to a view, its frame is subtracted from the masked region. This
means content behind the unmasked view will also become visible in the screenshot.
Use this for:
- Non-sensitive SwiftUI content you want to remain visible in screenshots
- Structural views like navigation titles, icons or static labels that contain no user data
```swift
Text("Welcome back")
.msrUnmask()
```
> [!NOTE]
> `.msrUnmask()` takes precedence over automatic masking for the specific view it is applied to.
> It does not affect sibling or parent views.
# Examples
## Masking a standalone Text view
By default, `Text` views outside a `List` are not automatically detected. Use `.msrMask()` to
ensure they are redacted.
```swift
var body: some View {
VStack {
Text("Account balance") // not sensitive, no modifier needed
Text("\(user.balance)") // sensitive — mask explicitly
.msrMask()
}
}
```
## Unmasking content inside a SwiftUI screen
Because all SwiftUI content is masked by default via `_UIHostingView`, use `.msrUnmask()` to
expose non-sensitive content.
```swift
var body: some View {
VStack {
Text("Hello, \(user.name)") // sensitive — remains masked by default
Image(systemName: "star") // not sensitive — unmask explicitly
.msrUnmask()
}
}
```
## Mixed masking in a form
In a form with both sensitive and non-sensitive fields, use both modifiers together.
```swift
var body: some View {
Form {
Section("Profile") {
Text("Username") // label — unmask
.msrUnmask()
TextField("Username", text: $username)
// UITextField — masked automatically
}
Section("Security") {
Text("Password") // label — unmask
.msrUnmask()
SecureField("Password", text: $password)
// UITextField — masked automatically
Text(sensitiveHint) // sensitive Text — mask explicitly
.msrMask()
}
}
}
```
> [!WARNING]
> Do not use `.msrUnmask()` on views that contain or overlap sensitive content. The unmasked
> frame is subtracted from the masked region, which means any sensitive content behind it will
> also become visible in the screenshot.
---
Source: https://measure.sh/docs/features/feature-screenshot-masking-flutter
---
# Screenshot Masking for Flutter
Measure captures screenshots on fatal erros, unhandled errors and bug reports. Before a screenshot leaves the device,
sensitive content is redacted so it does not leak to the server.
On Flutter, masking traverses the widget tree under the `MeasureWidget` and paints over the regions
that match the configured [screenshot mask level](https://measure.sh/docs/configuration-options).
# Table of Contents
* [**How Flutter Masking Works**](#how-flutter-masking-works)
* [**Mask Levels**](#mask-levels)
* [**Manual Masking**](#manual-masking)
* [**`MsrMask`**](#msrmask)
* [**Examples**](#examples)
# How Flutter Masking Works
Masking walks the widget tree under the `MeasureWidget` that wraps your app and collects the regions
to redact:
- **Text** — `Text` and `RichText`
- **Input fields** — `TextField` and `EditableText`
- **Images** — `Image`
Whether each region is masked depends on the active mask level. Two details are specific to Flutter:
- **Clickable detection** is best-effort, based on the widget type. Text inside buttons, `InkWell`,
or a `GestureDetector` with handlers is treated as clickable.
- **Sensitive detection** treats a `TextField` as sensitive when `obscureText` is `true`, or when its
`keyboardType` is `emailAddress`, `phone`, or `visiblePassword`. Sensitive fields are always
masked, even at the *all text except clickable* level.
# Mask Levels
The mask level is configured remotely from the dashboard and applies to all platforms. See
[Screenshot Mask Level](https://measure.sh/docs/configuration-options) for the full list of levels
and what each one redacts.
# Manual Masking
## `MsrMask` Widget
Automatic detection covers standard text, input and image widgets. To always mask anything else,
wrap it with `MsrMask`. The wrapped widget's area is always redacted, regardless of the configured
mask level.
```dart
MsrMask(
child: AccountBalance(amount: balance),
)
```
---
Source: https://measure.sh/docs/features/feature-app-launch-metrics
---
# App Launch Metrics
* [**Introduction**](#introduction)
* [**Sampling**](#sampling)
* [**How It Works**](#how-it-works)
* [**Android**](#android)
* [**iOS**](#ios)
## Introduction
Measure automatically tracks cold, warm and hot app launches along with the time taken for each. No sampling is done, ensuring that the data is accurate and represents the real-world performance of your app.
- **Cold Launch**: The time taken to launch the app from scratch.
- **Warm Launch**: The time taken to launch the app from a previously cached state.
- **Hot Launch**: The time taken to launch the app when it is already running in the background.
You can easily track these metrics in the dashboard, allowing you to monitor the performance of your app's launch.

## Sampling
See [Configuration Options](https://measure.sh/docs/configuration-options) for details on how to configure sampling for launch
metrics.
## How It Works
* [**Android**](#android)
* [**iOS**](#ios)
### Android
#### Cold Launch
A [cold launch](https://developer.android.com/topic/performance/vitals/launch-time#cold) refers to an app starting
from scratch. Cold launch happens in cases such as an app launching for the first time since the device booted or since
the system killed the app.
There are typically two important metrics to track for a cold launch:
1. **Time to Initial Display (TTID)** - the time taken from when the app was launched to when the first frame is displayed.
2. **Time to Full Display (TTFD)** - the time taken from when the app was launched to when the first meaningful content is displayed to the user.
> [!NOTE]
> Measuring TTFD is not possible yet; support will be added in a future version.
Meanwhile, **Time to Initial Display (TTID)** is automatically calculated by recording two timestamps:
1. The time when the app was launched.
2. The time when the app's first frame was displayed.
_The time when the app was launched_ is calculated differently for different SDK versions. We use the most accurate measurement possible for the given SDK version.
* Up to API 24: the _uptime_ when Measure content provider's attachInfo callback is invoked.
* API 24 - API 32: the process start uptime, using [Process.getStartUptimeMillis](https://developer.android.com/reference/android/os/Process#getStartUptimeMillis())
* API 33 and beyond: the process start uptime, using [Process.getStartRequestedUptimeMillis](https://developer.android.com/reference/android/os/Process#getStartRequestedUptimeMillis())
_The time when the app's first frame was displayed_ is a bit more complex. Simplifying some of the steps, it is calculated in the following way:
1. Get the decor view by registering [onContentChanged](https://developer.android.com/reference/android/app/Activity#onContentChanged()) callback on the first Activity.
2. Get the next draw callback by registering [OnDrawListener](https://developer.android.com/reference/android/view/ViewTreeObserver.OnDrawListener) on the decor view.
3. [Post a runnable in front of the next draw callback](https://github.com/square/papa/blob/main/papa/src/main/java/papa/internal/Handlers.kt#L8-L13) to record the time just before the first frame was displayed.
#### Warm Launch
A [warm launch](https://developer.android.com/topic/performance/vitals/launch-time#warm) refers to the re-launch of an
app causing an Activity `onCreate` to be triggered instead of just `onResume`. This requires the system to recreate
the activity from scratch and hence requires more work than a hot launch.
Warm launch is calculated by keeping track of the time when the Activity `onCreate` of the Activity being recreated is triggered and the time when the first frame is displayed. The same method as for cold launch is used to calculate the time when the first frame is rendered.
#### Hot Launch
A [hot launch](https://developer.android.com/topic/performance/vitals/launch-time#hot) refers to the re-launch of an
app causing an Activity `onResume` to be triggered. This typically requires less work than a warm launch as the system
does not need to recreate the activity from scratch. However, if there were any trim memory events leading to the
certain resources being released, the system might need to recreate those resources.
#### Further Reading
* [Android docs on app startup](https://developer.android.com/topic/performance/vitals/launch-time#warm)
* [Py's android vitals series](https://dev.to/pyricau/series/7827)
* [Py's PAPA GitHub project](https://github.com/square/papa)
### iOS
#### Cold Launch
A cold launch refers to an app starting up from scratch. Cold launches occur when the app is launched after a reboot or when the app is updated. When an app is launched from scratch, the app is brought from the disk to the memory, iOS loads startup system-side services that support the app, frameworks and daemons that the app depends on to launch might also require re-launching and paging in from disk. Once this is done, the process is spanned.
#### Warm Launch
Once a cold launch is done, for every subsequent launch, the app still needs to be spanned but the app is still in memory and some of the system-side services are already available. So this launch is a bit faster and a bit more consistent. This type of launch is referred to as the warm launch.
In iOS 15 and later, the system may, depending on device conditions, **pre-warm** your app, launching non-running application processes to reduce the amount of time the user waits before the app is usable. If a app is pre-warmed, we ignore the launch event.
#### Hot Launch
A hot launch occurs when a user reenters your app from either the home screen or the app switcher. As you know, the app is already launched at this point, so it's going to be very fast. Apple generally refers to this as a `resume` rather than a hot launch.
#### Further Reading
* [WWDC talk on app startup](https://developer.apple.com/videos/play/wwdc2019/423)
* [Reducing your app launch time](https://developer.apple.com/documentation/xcode/reducing-your-app-s-launch-time)
---
Source: https://measure.sh/docs/features/feature-network-monitoring
---
# Network Monitoring
* [**Overview**](#overview)
* [**Configuration Options**](#configuration-options)
* [**Top endpoints**](#top-endpoints)
* [**Request timeline**](#request-timeline)
* [**Searching for endpoints**](#searching-for-endpoints)
* [**How are endpoint patterns generated**](#how-are-endpoint-patterns-generated)
Measure SDK can capture network requests, responses and failures along with useful metrics to help understand how APIs
are performing in production from an end user perspective.
## Overview
Most heavy lifting of network monitoring is done automatically by the Measure SDK. There are a lot of configuration
options available to control the behavior of network monitoring.
#### Android
On Android, network requests made using the following clients, including any third party libraries that use them,
are automatically tracked by simply adding the Measure Android Gradle Plugin:
* [OkHttp](https://square.github.io/okhttp/): supported versions `4.7.0` to `5.3.2`. Requests made with versions
outside this range will not be auto-instrumented.
* [HttpURLConnection](https://developer.android.com/reference/java/net/HttpURLConnection): requires minimum
Android SDK version: 0.18.0.
##### Using Retrofit
[Retrofit](https://square.github.io/retrofit/) uses OkHttp under the hood, but as a transitive dependency.
Auto-instrumentation does not work with transitive dependencies, so projects that depend only on Retrofit
are not instrumented automatically. Use one of the following workarounds:
**Option 1: Declare OkHttp as a direct dependency**
Pin the OkHttp version explicitly in your `build.gradle.kts`. This lets auto-instrumentation work without
any code changes:
```kotlin
dependencies {
implementation("com.squareup.retrofit2:retrofit:3.0.0")
implementation("com.squareup.okhttp3:okhttp:4.12.0")
}
```
**Option 2: Add the interceptor manually**
Configure the `OkHttpClient` passed to Retrofit with Measure's interceptor and event listener factory:
```kotlin
val client = OkHttpClient.Builder()
.addInterceptor(MeasureOkHttpApplicationInterceptor())
.eventListenerFactory(MeasureEventListenerFactory(null))
.build()
val retrofit = Retrofit.Builder()
.baseUrl("https://api.example.com")
.client(client)
.build()
```
#### iOS
On iOS, network requests made using the [URLSession](https://developer.apple.com/documentation/foundation/urlsession),
including any third party libraries, are automatically tracked by simply adding the iOS SDK to your project.
#### Flutter
On Flutter, network requests made using the [Dio](https://pub.dev/packages/dio) package can be tracked by adding
the `measure_dio` package to your project. This package provides `MsrInterceptor` that can automatically
track network requests done using Dio.
```yaml
dependencies:
measure_dio: ^0.3.0
```
```dart
final dio = Dio();
dio.interceptors.add(MsrInterceptor());
```
For any other HTTP client libraries, you can manually track network requests using the `trackHttpEvent` method.
Example using `http` package:
```dart
import 'package:http/http.dart' as http;
import 'package:measure/measure.dart';
Future trackedGet(Uri uri, {Map? headers}) async {
return _trackRequest(() => http.get(uri, headers: headers), uri, 'get', headers);
}
Future trackedPost(Uri uri, {Map? headers, Object? body}) async {
return _trackRequest(() => http.post(uri, headers: headers, body: body), uri, 'post', headers, body);
}
Future _trackRequest(
Future Function() request,
Uri uri,
String method,
Map? headers,
[Object? body]
) async {
final measure = Measure.instance;
final startTime = measure.getCurrentTime();
try {
final response = await request();
measure.trackHttpEvent(
url: uri.toString(),
method: method,
statusCode: response.statusCode,
startTime: startTime,
endTime: measure.getCurrentTime(),
requestHeaders: headers,
responseHeaders: response.headers,
requestBody: body?.toString(),
responseBody: response.body,
client: 'http',
);
return response;
} catch (e) {
measure.trackHttpEvent(
url: uri.toString(),
method: method,
startTime: startTime,
endTime: measure.getCurrentTime(),
failureReason: e.runtimeType.toString(),
failureDescription: e.toString(),
requestHeaders: headers,
requestBody: body?.toString(),
client: 'http',
);
rethrow;
}
}
```
#### React Native
On React Native, `fetch` and `XHR` requests use URLSession on iOS and OkHttp on Android under the hood. HTTP
events are automatically tracked on iOS, but require additional setup on Android.
##### Android
To track HTTP events on Android, configure a custom `OkHttpClient` with `OkHttpClientProvider` in
`MainApplication.kt`:
```kotlin
OkHttpClientProvider.setOkHttpClientFactory(object : OkHttpClientFactory {
override fun createNewNetworkModuleClient(): OkHttpClient {
return OkHttpClient.Builder()
.cookieJar(ReactCookieJarContainer())
.addInterceptor(MeasureOkHttpApplicationInterceptor())
.eventListenerFactory(MeasureEventListenerFactory(null))
.build()
}
})
```
Without this configuration, HTTP events are not tracked on Android.
##### iOS
HTTP requests are tracked automatically on iOS. To also capture HTTP responses, add `MSRNetworkInterceptor` to
the session configuration in `AppDelegate.mm`:
```objc
RCTSetCustomNSURLSessionConfigurationProvider(^NSURLSessionConfiguration *{
NSURLSessionConfiguration *configuration = [NSURLSessionConfiguration defaultSessionConfiguration];
[MSRNetworkInterceptor enableOn:configuration];
return configuration;
});
```
##### Manual tracking
For HTTP clients not automatically instrumented, use `Measure.trackHttpEvent`:
```typescript
import { Measure } from '@measuresh/react-native';
const startTime = Measure.getCurrentTime();
try {
const response = await fetch('https://api.example.com/data');
await Measure.trackHttpEvent({
url: 'https://api.example.com/data',
method: 'GET',
startTime,
endTime: Measure.getCurrentTime(),
statusCode: response.status,
});
} catch (error) {
await Measure.trackHttpEvent({
url: 'https://api.example.com/data',
method: 'GET',
startTime,
endTime: Measure.getCurrentTime(),
error: (error as Error).message,
});
}
```
## Configuration Options
See [Configuration Options - HTTP Events](https://measure.sh/docs/configuration-options) for all available options.
## Top endpoints
The top endpoints section provides a ranked summary of your app's API endpoints across three dimensions:
* **Slowest** - endpoints ranked by p95 latency, helping identify the slowest APIs affecting user experience.
* **Highest Error %** - endpoints ranked by the percentage of 4xx and 5xx responses, highlighting unreliable APIs.
* **Most Frequent** - endpoints ranked by total request count, showing which APIs are called most often.
Clicking on any endpoint navigates to a detailed view with latency percentile charts (p50, p90, p95, p99) and
status code distribution over time.
These metrics are computed only for [endpoint patterns](#how-are-endpoint-patterns-generated) that have been
automatically generated. New endpoints will appear here once enough traffic has been collected to generate a
pattern.

## Request timeline
> This feature requires minimum SDK version: Android 0.16.2 and iOS 0.9.2
The request timeline is a heatmap that visualizes when network requests happen relative to session start. This helps
answer questions like "which APIs fire immediately on app launch?" and "are there endpoints being called repeatedly
in the background?"
The timeline shows the top [endpoint patterns](#how-are-endpoint-patterns-generated) ranked by request frequency.
New endpoints will appear here once enough traffic has been collected to generate a pattern.

## Searching for endpoints
You can search for any endpoint by typing its path in the "Explore endpoint" search bar. You can type the
exact path or use wildcards to find multiple matching endpoints.
#### Exact path
Type the full path to find a specific endpoint:
* `/v1/login` — matches only `/v1/login`
* `/api/users/123/profile` — matches only `/api/users/123/profile`
#### Using `*` to match any single part
A `*` stands in for any single part of a path:
* `/users/*/orders` — matches `/users/123/orders`, `/users/abc/orders`, etc.
* `/api/*/profile/*` — matches `/api/users/profile/avatar`, `/api/teams/profile/settings`, etc.
#### Using `**` to match everything after a prefix
Place `**` at the end of a path to match everything that follows:
* `/users/**` — matches `/users/123`, `/users/123/orders`, `/users/123/orders/456`, etc.
* `/api/v1/**` — matches `/api/v1/login`, `/api/v1/users/123/profile`, etc.
Note: `**` can only be used at the end of a path.
#### Mixing `*` and `**`
You can use `*` for specific parts and end with `**` to match the rest:
* `/api/*/users/**` — matches `/api/v1/users/123`, `/api/v2/users/123/orders/456`, etc.
## How are endpoint patterns generated
Measure automatically groups similar URLs into patterns so that requests like
`/api/users/123/profile` and `/api/users/456/profile` are grouped together as `/api/users/*/profile`.
A pattern is only created once it receives significant traffic - at least 100 requests in an hour. Once
established, patterns are retained as long as they continue to receive traffic. Patterns are discovered every
hour, and once available, metrics are refreshed every 15 minutes.
Raw URLs are grouped into patterns in two stages:
**1. Path normalization** - Each segment of a URL path is checked against known dynamic value formats. Segments
that match any of the following are replaced with a `*` wildcard:
* UUIDs (e.g. `550e8400-e29b-41d4-a716-446655440000`)
* SHA1 and MD5 hashes
* ISO 8601 date prefixes (e.g. `2024-01-15T...`)
* Hex values (e.g. `0x1a2b3c`)
* Integers with 2 or more digits (single-digit segments like `v1` are preserved)
For example, `/api/users/550e8400-e29b-41d4-a716-446655440000/orders/12345` becomes `/api/users/*/orders/*`.
**2. High-cardinality detection** - Some dynamic segments don't match a known format like UUIDs or integers.
For these, Measure looks at the variety of values seen in each position of a path. If a segment has many distinct
values (e.g. `/api/products/abc`, `/api/products/xyz`, ...), it is automatically replaced with `*` to form
`/api/products/*`.
---
Source: https://measure.sh/docs/features/feature-network-connectivity-changes
---
# Network Connectivity Changes
* [**Android**](#android)
* [**iOS**](#ios)]
* [**Flutter**](#flutter)
Measure SDK captures changes to network connection state of the device. This includes changes to the type of network
connection (WiFi, Mobile, etc.), the network provider (Airtel, T-Mobile, etc.) and the network generation (2G, 3G, 4G,
etc.).
## Android
> [!NOTE]
> The SDK does not add any new permissions to the app. It only uses the permissions that the app already has.
> Network connection state change feature is only enabled if the necessary permissions are already granted
> to the app.
Measure monitors changes in network. It is enabled only when the app is granted the
ACCESS_NETWORK_STATE permission and the device is running on Android M (SDK 23) or a higher version.
Measure does not add any new permissions to the app. It only uses the permissions that the app already has.
Tracking of [network_generation] is limited to Cellular network for Android M (SDK 23) and later.
This requires the app to hold the [READ_PHONE_STATE](https://developer.android.com/reference/android/Manifest.permission#READ_PHONE_STATE)
permission, which is a runtime permission. In case the user denies this permission, network generation will not be captured. For devices running
Android Tiramisu (SDK 33) or later, [READ_BASIC_PHONE_STATE](https://developer.android.com/reference/android/Manifest.permission#READ_BASIC_PHONE_STATE)
permission is sufficient, and it does not require a runtime permission.
## iOS
To detect network changes, Measure relies on NWPathMonitor's `pathUpdateHandler`. The `pathUpdateHandler` provides a callback whenever the network changes between cellular and Wi-Fi. Additionally, we perform independent checks to detect if the connection is accessed via VPN or if no internet is available. We rely on `CTTelephonyNetworkInfo` to get carrier information.
> [!IMPORTANT]
> Starting from iOS 16.4, access to the `network_provider` is no longer available and will be removed in a future
> release of the SDK.
## Flutter
Network changes are collected for Flutter apps based on the platform the app is running on (Android or iOS). The SDK uses the
same methods as described above for Android and iOS.
## React Native
Network changes are collected for React Native apps based on the platform the app is running on (Android or iOS). The SDK uses the
same methods as described above for Android and iOS.
---
Source: https://measure.sh/docs/features/feature-navigation-lifecycle-tracking
---
# Navigation & Lifecycle Tracking
- [**Introduction**](#introduction)
- [**Lifecycle events**](#lifecycle-events)
- [**Android**](#android)
- [**Activity Lifecycle**](#activity-lifecycle)
- [**Fragment Lifecycle**](#fragment-lifecycle)
- [**AndroidX Navigation**](#androidx-navigation)
- [**iOS**](#ios)
- [**View Controller Lifecycle**](#view-controller-lifecycle)
- [**SwiftUI lifecycle**](#swiftui-lifecycle)
- [**Flutter**](#flutter)
- [**React Native**](#react-native)
- [**Manually track screen views**](#manually-track-screen-views)
- [**Application foregrounded/backgrounded**](#application-foregroundedbackgrounded)
## Introduction
When debugging your application, understanding how users navigate through your app and how different components of your
app are initialized and destroyed is crucial. Measure provides automatic tracking of many lifecycle events in
your application, allowing you to gain insights into user journeys and component lifecycles without writing additional
code. There is also an option to manually track screen views if you need more control over what is tracked.
For _Android_, Lifecycle events for Activity, Fragments and from AndroidX navigation library (including compose) are
automatically tracked.
For _iOS_, lifecycle events for View Controllers are automatically tracked. For `SwiftUI`, you can track lifecycle
events by wrapping your views with `MsrMoniterView` or using the `moniterWithMsr` extension.
Application foregrounded and backgrounded events are also automatically tracked, allowing you to understand when the
application is visible to the user and when it is not.
Apart from these automatically collected events, `trackScreenView` method can be used to manually track screen views
in your application. This is useful for getting a more detailed view of user's journey depending on how your app is
structured.
## Application foregrounded/backgrounded
Measure automatically tracks when the application has come to foreground (is visible to the user) and when
it has been put into background (is no longer visible to the user).
## Lifecycle events
### Android
#### Activity Lifecycle
Measure automatically tracks the following Activity lifecycle events:
1. [Created](https://developer.android.com/guide/components/activities/activity-lifecycle#oncreate)
2. [Resumed](https://developer.android.com/guide/components/activities/activity-lifecycle#onresume)
3. [Paused](https://developer.android.com/guide/components/activities/activity-lifecycle#onpause)
4. [Destroyed](https://developer.android.com/guide/components/activities/activity-lifecycle#ondestroy)
#### Fragment Lifecycle
Measure automatically tracks the following Fragment lifecycle events:
1. [Attached](https://developer.android.com/reference/androidx/fragment/app/Fragment.html#onAttach(android.content.Context))
2. [Resumed](https://developer.android.com/reference/androidx/fragment/app/Fragment.html#onResume())
3. [Paused](https://developer.android.com/reference/androidx/fragment/app/Fragment.html#onPause())
4. [Detached](https://developer.android.com/reference/androidx/fragment/app/Fragment.html#onDetach())
#### AndroidX Navigation
If you rely on AndroidX Navigation library for navigation in your Android app, a `screen_view` event is automatically
tracked whenever a new destination is navigated to. This works using the instrumentation added by Measure Gradle Plugin
and no code changes are needed to track these events.
Supported `androidx.navigation:navigation-compose` versions: `2.4.0` to `2.9.7`. Apps using versions outside this
range will not be auto-instrumented.
### iOS
#### View Controller Lifecycle
Measure automatically tracks the following View Controller lifecycle events:
1. `viewDidLoad`
2. `viewWillAppear`
3. `viewDidAppear`
4. `viewWillDisappear`
5. `viewDidDisappear`
6. `didReceiveMemoryWarning`
7. `initWithNibName`
8. `initWithCoder`
> [!TIP]
>
> You can also track `loadView` and `deinit`/`dealloc` by inheriting from `MsrViewController` for swift
> and `MSRViewController` for ObjC. An example of how to do this is shown below.
Using Swift:
```swift
class ViewController: MsrViewController {
...
}
```
Using Objective-C:
```objc
@interface ObjcDetailViewController: MSRViewController
...
@end
```
#### SwiftUI lifecycle
Measure can track SwiftUI component's `onAppear` and `onDisappear` if you wrap your view with the `MsrMoniterView`. It
ensures that each appearance event is only triggered once per lifecycle instance. Additionally, you can use
the `moniterWithMsr` extension to conveniently wrap any SwiftUI view.
Example usage:
**Using `MsrMoniterView`:**
```swift
struct ContentView: View {
var body: some View {
MsrMoniterView("ContentView") {
Text("Hello, World!")
}
}
}
```
**Using `moniterWithMsr`:**
```swift
struct ContentView: View {
var body: some View {
Text("Hello, World!")
.moniterWithMsr("ContentView")
}
}
```
### React Native
The React Native SDK does not automatically track navigation events because React Native apps commonly use
a variety of navigation libraries (e.g., React Navigation, Expo Router). Use `Measure.trackScreenView` to
manually record screen view events when navigating between screens.
For apps using [React Navigation](https://reactnavigation.org/), you can hook into the `onStateChange` callback
of `NavigationContainer`:
```typescript
import { Measure } from '@measuresh/react-native';
import { NavigationContainer } from '@react-navigation/native';
function App() {
return (
{
const currentRoute = state?.routes[state.index];
if (currentRoute?.name) {
Measure.trackScreenView({ screenName: currentRoute.name });
}
}}
>
{/* ... */}
);
}
```
All underlying native Android and iOS lifecycle events (Activity, Fragment, UIViewController) are still
automatically tracked for React Native apps.
## Manually track screen views
If you want to manually track screen views in your application, you can use the `trackScreenView` method. This is useful
when you want to track specific screens or views that are not automatically tracked by Measure.
#### Android
```kotlin
Measure.trackScreenView("Screen Name")
```
From version `0.12.0` onwards, you can also add attributes to the tracked screen view, which can be useful for
providing additional context about the screen.
- Attribute keys must be strings with a maximum length of 256 characters.
- Attribute values must be one of the primitive types: `int`, `long`, `double`, `float` or `boolean`.
- String attribute values can have a maximum length of 256 characters.
```kotlin
Measure.trackScreenView(
"TrackOrder",
AttributesBuilder().put("order-id", "12345")
.build()
)
```
#### iOS
Using Swift:
```swift
Measure.trackScreenView("Home")
```
Using ObjC:
```objc
[Measure trackScreenView:@"Home"];
```
#### Flutter
To hook up with the Flutter navigation system, use the `MsrNavigatorObserver` which automatically tracks screen views
when navigating between screens. You can add it to your `MaterialApp` or `CupertinoApp` as follows:
```dart
@override
Widget build(BuildContext context) {
return MaterialApp(
navigatorObservers: [MsrNavigatorObserver()],
home: HomeScreen(),
);
}
```
To manually track screen views in a Flutter application, you can use the `trackScreenViewEvent` method from the Measure SDK:
```dart
Measure.instance.trackScreenViewEvent(name: "Home");
```
> [!Note]
> All Android/iOS lifecycle events are also automatically tracked for Flutter.
#### React Native
```typescript
import { Measure } from '@measuresh/react-native';
Measure.trackScreenView({ screenName: "Home" });
```
You can also include attributes to provide additional context:
```typescript
Measure.trackScreenView({ screenName: "TrackOrder", attributes: { order_id: "12345" } });
```
---
Source: https://measure.sh/docs/features/feature-cpu-monitoring
---
# CPU Monitoring
- [**Android**](#android)
- [**iOS**](#ios)
- [**Flutter**](#flutter)
Measure SDK captures CPU usage periodically (defaults to 3 seconds) when the app is in foreground.
## Android
To calculate the CPU usage, two sets of information are required:
1. The CPU specification: The number of cores and the maximum frequency of each core. Number of cores are read from
`Os.sysconf(OsConstants._SC_NPROCESSORS_CONF)` and the maximum frequency is read
from `Os.sysconf(OsConstants._SC_CLK_TCK)`.
2. CPU time: The time spent by the CPU in executing instructions for an app. This information is read
from `/proc/self/stat` file which is written to by the OS.
The [/proc/self/stat](https://man7.org/linux/man-pages/man5/proc.5.html) file contains a number of metrics out of which
we are interested only in the following:
1. utime - Amount of time that this process has been scheduled in user mode (this is where most of the application code
runs), measured in clock ticks.
2. stime - Amount of time that this process has been scheduled in kernel mode (this is where most system processes run),
measured in clock ticks.
3. cutime - Amount of time that this process's waited-for children have been scheduled in user mode, measured in clock
ticks.
4. cstime - Amount of time that this process's waited-for children have been scheduled in kernel mode, measured in clock
ticks.
The average %CPU usage by the application in a given interval is calculated using:
$\frac{{(utime - prev.utime) + (stime - prev.stime) + (cutime - prev.cutime) + (cstime - prev.cstime)}}{{clock\ speed \times interval \times number\ of\ cores}}$
Where:
* `prev.utime`, `prev.stime`, `prev.cutime`, `prev.cstime` are values from the previous event collected.
* `interval` is the time between two consecutive `cpu_usage` events.
## iOS
Measure SDK calculates CPU usage by retrieving task and thread information using macOS/iOS system APIs. It performs the following steps:
- Retrieve Task-Level CPU Usage:
- Uses task_info with `TASK_BASIC_INFO` to get overall CPU time for the process.
- This provides details such as total user time, system time and memory usage.
- Retrieve Thread-Level CPU Usage:
- Uses task_threads to obtain a list of active threads within the process.
- Iterates through each thread and calls `thread_info` with `THREAD_BASIC_INFO`.
- Extracts per-thread CPU usage statistics and aggregates them.
- Calculate CPU Usage Percentage:
- Each thread's CPU usage (cpu_usage field) is a fraction of `TH_USAGE_SCALE` (100% CPU time).
- The SDK converts this into a percentage by summing the CPU usage of all non-idle threads and normalizing it against `TH_USAGE_SCALE`.
This provides an estimate of how much CPU time the app is consuming relative to available CPU resources.
## Flutter
CPU usage is collected for Flutter apps based on the platform the app is running on (Android or iOS). The SDK uses the
same methods as described above for Android and iOS.
## React Native
CPU usage is collected for React Native apps based on the platform the app is running on (Android or iOS). The SDK uses the
same methods as described above for Android and iOS.
#### Further reading
* [Task Info](https://web.mit.edu/darwin/src/modules/xnu/osfmk/man/task_info.html)
* [Thread Info](https://web.mit.edu/darwin/src/modules/xnu/osfmk/man/thread_info.html)
* [Thread Basic Info](https://web.mit.edu/darwin/src/modules/xnu/osfmk/man/thread_basic_info.html)
---
Source: https://measure.sh/docs/features/feature-memory-monitoring
---
# Memory Monitoring
- [Introduction](#introduction)
- [Android](#android)
- [iOS](#ios)
- [Flutter](#flutter)
## Introduction
Measure automatically tracks memory usage for each session. Memory usage is shown along with the session timeline
and can be used to identify memory leaks or excessive memory usage in your app.
## Android
A worker thread reads the following properties every 2 seconds and reports them to Measure:
* **Max heap size** - The maximum amount of memory that the app can use. Collected
using [Runtime.maxMemory](https://developer.android.com/reference/java/lang/Runtime#maxMemory()).
* **Total heap size** - The total amount of memory that the app is currently using. Collected
using [Runtime.totalMemory](https://developer.android.com/reference/java/lang/Runtime#totalMemory()).
* **Free heap size** - The amount of memory that is currently free. Collected
using [Runtime.freeMemory](https://developer.android.com/reference/java/lang/Runtime#freeMemory()).
* **RSS (Resident set size)** - The amount of memory that the app is currently using, including the memory used by the
native code. Collected by reading the [proc/pid/statm](https://man7.org/linux/man-pages/man5/proc.5.html) file.
* **Total PSS (Proportional set size)** - The total amount of memory that the app is currently using, including the
memory used by the native code, but excluding the memory used by the system. Collected
using [Debug.getMemoryInfo](https://developer.android.com/reference/android/os/Debug#getMemoryInfo(android.os.Debug.MemoryInfo)).
* **Native total heap size** - The total amount of memory that the app is currently using for native code. Collected
using [Debug.getNativeHeapSize](https://developer.android.com/reference/android/os/Debug#getNativeHeapSize()).
* **Native free heap size** - The amount of memory that is currently free for native code. Collected
using [Debug.getNativeFreeHeapSize](https://developer.android.com/reference/android/os/Debug#getNativeHeapFreeSize()).

## iOS
Measure SDK calculates memory usage using the `task_info` API with the `TASK_VM_INFO` flavor. This API provides detailed
memory statistics for the app’s process. The SDK extracts the `phys_footprint` value, which represents the physical
memory footprint of the app. This value accounts for real memory pages in use, shared memory overhead and
compressed memory, making it an accurate measure of the app’s actual memory consumption.
If `phys_footprint` is unavailable, the SDK falls back to `resident_size`, which represents the resident memory size
allocated to the process. However, `resident_size` does not reflect memory compression or pressure, so it may
underreport actual memory usage compared to `phys_footprint`.
SDK falls back to `resident_size` in below cases:
- If `phys_footprint` is zero or not available due to system constraints.
- If the `task_info` API call fails (rare, but possible due to system restrictions or sand-boxing).

#### Impact on Dashboard Metrics
When `phys_footprint` is available, the reported memory usage reflects actual memory pressure.
When `resident_size` is used, the reported value may be lower than real usage since it excludes compressed memory.
The dashboard does not currently indicate when the SDK falls back to `resident_size`, but unusually low memory usage
readings may suggest this fallback occurred.
#### Further reading
* [Task Info](https://web.mit.edu/darwin/src/modules/xnu/osfmk/man/task_info.html)
* [iOS Memory Deep Dive](https://developer.apple.com/videos/play/wwdc2018/416/)
* [Apple Developer Forum Thread](https://developer.apple.com/forums/thread/105088)
## Flutter
Memory usage is collected for Flutter apps based on the platform the app is running on (Android or iOS). The SDK uses the
same methods as described above for Android and iOS.
## React Native
Memory usage is collected for React Native apps based on the platform the app is running on (Android or iOS). The SDK uses the
same methods as described above for Android and iOS.
---
Source: https://measure.sh/docs/features/feature-identify-users
---
# Identify users
Correlating sessions with users is critical for debugging certain issues. You can set a user ID which can then be used
to query sessions on the dashboard.
Note that the User ID is persisted across app launches automatically.
> [!IMPORTANT]
>
> It is recommended to **avoid** the use of PII (Personally Identifiable Information) in the
> user ID like email, phone number or any other sensitive information. Instead, use a hashed
> or anonymized user ID to protect user privacy.
### Android
To set a user ID.
```kotlin
Measure.setUserId("user-id")
```
To clear a user ID.
```kotlin
Measure.clearUserId()
```
### iOS
To set a user ID.
```swift
Measure.setUserId("user-id")
```
To clear a user ID.
```swift
Measure.clearUserId()
```
### Flutter
To set a user ID.
```dart
Measure.instance.setUserId("user-id");
```
To clear a user ID.
```dart
Measure.instance.clearUserId();
```
### React Native
To set a user ID.
```typescript
import { Measure } from '@measuresh/react-native';
Measure.setUserId({ userId: "user-id" });
```
To clear a user ID.
```typescript
Measure.clearUserId();
```
---
Source: https://measure.sh/docs/features/feature-manually-start-stop-sdk
---
# Manually Start and Stop the SDK
By default, initializing the SDK starts collection of events. To delay start to a different point in your app
set `autoStart` to `false` during initialization. This can be used to control the scope of where the SDK is active in
your application.
> [!IMPORTANT]
> Some SDK instrumentation remains active even when stopped. This is to maintain state and ensure seamless data
> collection when it is started.
> Additionally, cold, warm & hot launch events are also always captured. However, no data is sent to the server until
> the SDK is started.
### Android
```kotlin
Measure.init(
context, MeasureConfig(
// delay starting of collection
autoStart = false,
)
)
// Start collecting
Measure.start()
// Stop collecting
Measure.stop()
```
### iOS
```swift
let config = BaseMeasureConfig(autoStart: false) // delay starting of collection
let clientInfo = ClientInfo(apiKey: "", apiUrl: "")
Measure.initialize(with: clientInfo, config: config)
// Start collecting
Measure.start()
// Stop collecting
Measure.stop()
```
### Flutter
```dart
Future main() async {
await Measure.instance.init(
() =>
runApp(
MeasureWidget(child: MyApp()),
),
config: const MeasureConfig(
autoStart: false, // delay starting of collection
),
clientInfo: ClientInfo(
apiKey: "YOUR_API_KEY",
apiUrl: "YOUR_API_URL",
),
);
}
// Start collecting
Measure.instance.start();
// Stop collecting
Measure.instance.stop();
```
### React Native
```typescript
import { Measure, MeasureConfig } from '@measuresh/react-native';
await Measure.init({ config: new MeasureConfig({
autoStart: false, // delay starting of collection
}) });
// Start collecting
Measure.start();
// Stop collecting
Measure.stop();
```
---
Source: https://measure.sh/docs/features/feature-app-size-monitoring
---
# App Size Monitoring
* [**Android**](#android)
* [**iOS**](#ios)
Measure automatically calculates and tracks the size of your app over time.
## Android
Measure supports tracking size for both APKs
and AABs. The Measure Gradle Plugin automatically uploads the size information to Measure after an `assemble`
or `bundle`task completes successfully.
#### APK Size
The plugin calculates APK size by using
apkanalyzer [download-size](https://developer.android.com/tools/apkanalyzer#commands) command, which is the same tool
used by Android Studio to calculate APK sizes. The APK size captured represents the estimated download size of the APK
for the end user.
#### AAB Size
The plugin calculates AAB size by using bundletool's [get-size total](https://developer.android.com/tools/bundletool)
command. The AAB size captured represents the maximum size of the APK that can be generated from the AAB.
Read more about AAB format [here](https://developer.android.com/guide/app-bundle).
## iOS
Measure automatically tracks size of the IPA file for each version when you upload dSYMs using the [upload_dsym_xcarchive.sh](../../ios/Scripts/upload_dsym_xcarchive.sh) or [upload_dsym_manual.sh](../../ios/Scripts/upload_dsym_manual.sh) script.
> [!NOTE]
> This represents the size of the generated .ipa, not the actual App Store download size.
---
Source: https://measure.sh/docs/features/feature-alerts
---
# Alerts
Measure sends out alert notifications via email and slack on Crash spikes, ANR spikes and on receiving Bug Reports. Measure also sends out daily dummaries of core app metrics.
* [**Email Integration**](#email-integration)
* [**Setting Up Email**](#setting-up-email)
* [**Slack Integration**](#slack-integration)
* [**Connecting Slack Workspace**](#connecting-slack-workspace)
* [**Receiving Alerts**](#receiving-alerts)
* [**Stopping Alerts**](#stopping-alerts)
* [**Disabling Slack Integration**](#disabling-slack-integration)
## Email Integration
Email integration allows you to receive alert notifications and daily summaries in your inbox.
### Setting up email
If you are a self hosted user, please set up your email integration if you haven't done so using this [guide](https://measure.sh/docs/../hosting/smtp-email).
Once completed, all members in your team will receive emails for apps belonging to the same team.
## Slack Integration
Slack integration allows you to receive alert notifications and daily summaries directly in your Slack workspace.
### Connecting Slack Workspace
> [!NOTE]
>
> #### Self Hosted User
>
> If you are a self hosted user, please set up your slack integration if you haven't done so using this [guide](https://measure.sh/docs/../hosting/slack).
Click `Add to Slack` button and authorize Measure Slack App for your workspace.
### Receiving Alerts
To receive alert notifications in a channel, invite the Measure Slack app to the channel you wish to receive alerts in and then register it using the `/subscribe-alerts` slash command.
### Stopping Alerts
To stop alert notifications in a channel, use the `/stop-alerts` slash command in a channel that is subscribed for receiving alerts.
### Listing Active Alert Channels
To see all active channels that are subscribed for alerts, use the `/list-alert-channels` slash command in a channel that the Measure Slack app has been added to.
### Disabling Slack Integration
You can stop all alerts regardless of channel subscription by disabling the Slack integration in the `teams` page on the Dashboard.
---
Source: https://measure.sh/docs/features/feature-slack-integration
---
# Slack Integration
Measure's Slack integration lets you receive alert notifications and daily summaries directly in your Slack workspace.
* [**Connecting Your Slack Workspace**](#connecting-your-slack-workspace)
* [**Slash Commands**](#slash-commands)
* [`/subscribe-alerts`](#subscribe-alerts)
* [`/stop-alerts`](#stop-alerts)
* [`/list-alert-channels`](#list-alert-channels)
* [**Sending a Test Alert**](#sending-a-test-alert)
* [**Disabling Slack Integration**](#disabling-slack-integration)
* [**Self Hosted Setup**](https://measure.sh/docs/../hosting/slack)
## Connecting Your Slack Workspace
> [!NOTE]
>
> #### Self Hosted Users
>
> If you are a self hosted user, please set up your Slack app if you haven't done so using this [guide](https://measure.sh/docs/../hosting/slack).
Navigate to the **Team** settings page on the Measure dashboard and click the **Add to Slack** button. This will start an OAuth flow to authorize the Measure Slack app for your workspace.
Once connected, you will see a toggle to enable or disable the integration and a **Send Test Alert** button to verify the connection is working.
## Slash Commands
After connecting your workspace, invite the Measure bot to any channel where you want to receive alerts. Then use the following slash commands to manage alert subscriptions.
### `/subscribe-alerts`
Registers the current channel to receive alert notifications. The Measure bot must be invited to the channel before running this command.
### `/stop-alerts`
Unregisters the current channel from receiving alert notifications. Use this in a channel that is currently subscribed.
### `/list-alert-channels`
Lists all channels in your workspace that are currently registered to receive alert notifications. Use this in any channel where the Measure bot has been added.
## Sending a Test Alert
Once connected and enabled, you can verify your setup by clicking the **Send Test Alert** button on the **Team** settings page. This sends a test message to all subscribed channels.
## Disabling Slack Integration
You can stop all alerts across every channel at once by disabling the Slack integration toggle on the **Team** settings page. Individual channel subscriptions are preserved and will resume if you re-enable the integration.
---
Source: https://measure.sh/docs/features/feature-mcp
---
# MCP Server
Measure exposes a [Model Context Protocol](https://modelcontextprotocol.io) (MCP) server that lets AI-powered coding tools query your app's crash and error data directly.
* [**What is MCP?**](#what-is-mcp)
* [**Connecting to MCP via Coding Agents**](#connecting-to-mcp-via-coding-agents)
* [**Available Tools**](#available-tools)
* [`list_apps`](#list_apps)
* [`get_filters`](#get_filters)
* [`get_metrics`](#get_metrics)
* [`get_app_health_over_time`](#get_app_health_over_time)
* [`get_errors`](#get_errors)
* [`get_error`](#get_error)
* [`get_errors_over_time`](#get_errors_over_time)
* [`get_error_over_time`](#get_error_over_time)
* [`get_error_distribution`](#get_error_distribution)
* [`get_error_common_path`](#get_error_common_path)
* [`get_sessions`](#get_sessions)
* [`get_sessions_over_time`](#get_sessions_over_time)
* [`get_session`](#get_session)
* [`get_bug_reports`](#get_bug_reports)
* [`get_bug_reports_over_time`](#get_bug_reports_over_time)
* [`get_bug_report`](#get_bug_report)
* [`get_root_span_names`](#get_root_span_names)
* [`get_span_instances`](#get_span_instances)
* [`get_span_metrics_over_time`](#get_span_metrics_over_time)
* [`get_trace`](#get_trace)
* [`get_alerts`](#get_alerts)
* [`get_journey`](#get_journey)
* [`update_bug_report_status`](#update_bug_report_status)
## What is MCP?
The [Model Context Protocol](https://modelcontextprotocol.io) is an open standard that allows AI tools to interact with external data sources through a consistent interface. With Measure's MCP server, you can ask AI assistants to look up crashes, analyze error trends and inspect stack traces without leaving your editor.
## Connecting to MCP via Coding Agents
You can connect your favorite coding agents to Measure as a remote MCP server.
The MCP endpoint is available at:
| Version | Endpoint |
| ----------- | --------------------------------------------- |
| Cloud | `https://api.measure.sh/mcp` |
| Self Hosted | `https://[your-measure-api-domain]/mcp` |
Refer to your coding agent's documentation for the specific steps to add a remote MCP server. A few popular agent docs are linked here:
- [**Claude Code**](https://code.claude.com/docs/en/mcp)
- [**OpenAI Codex**](https://developers.openai.com/codex/mcp/)
- [**Gemini CLI**](https://geminicli.com/docs/tools/mcp-server/)
- [**XCode**](https://code.visualstudio.com/docs/copilot/customization/mcp-servers)
- [**Android Studio**](https://developer.android.com/studio/gemini/add-mcp-server)
- [**VSCode**](https://code.visualstudio.com/docs/copilot/customization/mcp-servers)
- [**Cursor**](https://cursor.com/docs/context/mcp)
- [**Windsurf**](https://docs.windsurf.com/windsurf/cascade/mcp)
When you first use a Measure tool, your coding agent will open a browser window for you to sign in to Measure. After authenticating subsequent requests will work automatically.
## Available Tools
### `list_apps`
List all apps the authenticated user has access to.
### `get_filters`
Get available filter options (versions, OS, countries, devices, etc.) for an app.
### `get_metrics`
Get app metrics including adoption, crash-free/ANR-free sessions and launch performance (cold/warm/hot p95).
### `get_app_health_over_time`
Get the app health timeline: sessions, crashes (fatal exceptions) and ANRs bucketed over time.
### `get_errors`
Get error groups (crashes, non-fatal exceptions and ANRs) for an app, filterable by error type and severity.
### `get_error`
Get individual error events (exception or ANR) for a specific error group.
### `get_errors_over_time`
Get time-series of error occurrences across all error groups, filterable by error type and severity.
### `get_error_over_time`
Get time-series of occurrences for a specific error group.
### `get_error_distribution`
Get attribute distribution (OS, device, version, country) for a specific error group.
### `get_error_common_path`
Get the most common user navigation path leading to a specific error group.
### `get_sessions`
Get sessions for an app, ordered by most recent first.
### `get_sessions_over_time`
Get time-series of session counts.
### `get_session`
Get full session with all events.
### `get_bug_reports`
Get bug reports for an app, ordered by most recent first.
### `get_bug_reports_over_time`
Get time-series of bug report counts.
### `get_bug_report`
Get a single bug report with full details.
### `update_bug_report_status`
Update the status of a bug report (open or closed).
### `get_root_span_names`
Get all root span names for an app.
### `get_span_instances`
Get span instances for a root span name.
### `get_span_metrics_over_time`
Get p50/p90/p95/p99 duration metrics over time for a span name.
### `get_trace`
Get full trace with all child spans.
### `get_alerts`
Get alerts for an app, ordered by most recent first.
### `get_journey`
Get user navigation journey graph with session counts between screens.
---
Source: https://measure.sh/docs/features/configuration-options
---
# Configuration Options
Measure provides a number of configuration options to customize data collection and SDK behavior. These options are
available in two ways:
* **SDK Options** — Set at initialization time in your app's code.
* **Remote Configuration Options** — Configured remotely from the Measure dashboard. Changes take effect without
releasing a new
app version.
# Table of Contents
* [**SDK Configuration Options**](#sdk-configuration-options)
* [**API Reference**](#api-reference)
* [**Android**](#android)
* [**iOS**](#ios)
* [**Flutter**](#flutter)
* [**React Native**](#react-native)
* [**trackActivityIntentData**](#trackactivityintentdata)
* [**enableLogging**](#enablelogging)
* [**autoStart**](#autostart)
* [**requestHeadersProvider**](#requestheadersprovider)
* [**maxDiskUsageInMb**](#maxdiskusageinmb)
* [**enableFullCollectionMode**](#enablefullcollectionmode)
* [**enableDiagnosticMode**](#enablediagnosticmode)
* [**Remote Configuration Options**](#remote-configuration-options)
* [**Crash Reporting**](#crash-reporting)
* [**ANR Reporting**](#anr-reporting)
* [**Trace Sampling**](#trace-sampling)
* [**Launch Metrics Sampling**](#launch-metrics-sampling)
* [**Journey Sampling**](#journey-sampling)
* [**HTTP Events**](#http-events)
* [**Screenshot Mask Level**](#screenshot-mask-level)
# SDK Configuration Options
## API Reference
#### Android
For Android, options can be set in the `MeasureConfig` object which is passed to the `Measure.init` method. Example:
```kotlin
Measure.init(
context, MeasureConfig(
enableLogging = true,
autoStart = true,
maxDiskUsageInMb = 50,
trackActivityIntentData = true,
requestHeadersProvider = customRequestHeadersProvider,
enableFullCollectionMode = false,
enableDiagnosticMode = false,
)
)
```
#### iOS
For iOS, options can be set in the `BaseMeasureConfig` object which is passed to the `Measure.initialize`
method. Example:
```swift
let config = BaseMeasureConfig(enableLogging: true,
autoStart: true,
maxDiskUsageInMb: 50,
requestHeadersProvider: customRequestHeadersProvider,
enableFullCollectionMode: false)
Measure.initialize(with: clientInfo, config: config)
```
#### Flutter
For Flutter, options can be set in the `MeasureConfig` object which is passed to the `Measure.init` method. Example:
```dart
Future main() async {
await Measure.instance.init(
() => runApp(MeasureWidget(child: MyApp())),
config: const MeasureConfig(
enableLogging: true,
autoStart: true,
enableDiagnosticMode: false,
),
);
}
```
#### React Native
For React Native, options can be set in the `MeasureConfig` object which is passed to the `Measure.init` method. Example:
```typescript
import { Measure, MeasureConfig } from '@measuresh/react-native';
const config = new MeasureConfig({
enableLogging: true,
autoStart: true,
enableDiagnosticMode: false,
});
await Measure.init({ config });
```
## `trackActivityIntentData`
_Applies only to Android._
Android [Intent](https://developer.android.com/reference/android/content/Intent#standard-extra-data)
can contain a bundle with any arbitrary information. While this can be useful to debug certain issues which require
checking what data was passed as part of the bundle, it might also contain sensitive information.
`trackActivityIntentData` allows enabling/disabling of collection of intent data for the following events:
* `lifecycle_activity.created` event, which is collected with the Activity lifecycle
event `onCreate` is triggered.
* `cold_launch` event, which is collected when the app is launched from a cold start.
* `warm_launch` event, which is collected when the app is launched from a warm start.
* `hot_launch` event, which is collected when the app is launched from a hot start.
Defaults to `false`.
## `enableLogging`
Allows enabling/disabling internal logging of Measure SDK. This is useful to debug issues with the SDK
itself.
Defaults to `false`.
## `autoStart`
Controls whether to start tracking immediately or delay starting the SDK.
Defaults to `true`.
Use `Measure.start` to start the SDK at a different point and `Measure.stop` to stop the SDK from tracking
data.
## `requestHeadersProvider`
Allows configuring custom HTTP headers for requests made by the Measure SDK to the Measure API. This is useful **only
for
self-hosted** clients who may require additional headers for requests in their infrastructure.
Defaults to `null`, which means no additional headers are added.
The following headers are reserved by the SDK and will be ignored if provided:
- `Content-Type`
- `msr-req-id`
- `Authorization`
- `Content-Length`
#### Android Usage
```kotlin
class CustomHeaderProvider : MsrRequestHeadersProvider {
private val requestHeaders: ConcurrentMap = ConcurrentHashMap()
fun addHeader(key: String, value: String) {
requestHeaders[key] = value
}
fun removeHeader(key: String) {
requestHeaders.remove(key)
}
override fun getRequestHeaders(): Map {
return requestHeaders.toMap() // Return immutable copy
}
}
Measure.init(
context, MeasureConfig(
requestHeadersProvider = CustomHeadersProvider()
)
)
```
#### iOS Usage
Using Swift:
```swift
class CustomHeaderProvider: NSObject, MsrRequestHeadersProvider {
func getRequestHeaders() -> NSDictionary {
return ["X-App-Version": "1.0.0"]
}
}
Measure.initialize(with: clientInfo, config: BaseMeasureConfig(requestHeadersProvider: CustomHeadersProvider()))
```
Using ObjC
```objc
@interface RequestHeaderProvider : NSObject
@end
@implementation RequestHeaderProvider
- (NSDictionary *)getRequestHeaders {
return @{ @"X-Custom-Header": @"value" };
}
@end
// add below snippet while initializing the SDK.
ClientInfo *clientInfo = [[ClientInfo alloc] initWithApiKey:@"api-key" apiUrl:@"api-url"];
BaseMeasureConfig *config = [[BaseMeasureConfig alloc] initWithEnableLogging:YES
autoStart:YES
requestHeadersProvider:NULL
maxDiskUsageInMb:nil
enableFullCollectionMode:NO
enableDiagnosticMode:NO
enableDiagnosticModeGesture:NO];
[Measure initializeWith:clientInfo config:config];
```
## `maxDiskUsageInMb`
Allows setting the maximum disk usage for Measure SDK. This is useful to control the amount of disk space
used by the SDK for storing session data, crash reports and other collected information.
All Measure SDKs store data to disk and upload it to the server in batches. While the app is in foreground, the data
is synced periodically and usually the disk space used by the SDK is low. However, if the device is offline
or the server is unreachable, the SDK will continue to store data on disk until it reaches the maximum disk usage limit.
Defaults to `50MB`. Allowed values are between `20MB` and `1500MB`. Any value outside this range will be clamped
to the nearest limit.
Note that the storage usage is not exact and works on estimates and typically the SDK will use much less disk space than
the configured limit. When the SDK reaches the maximum disk usage limit, it will start deleting the oldest data to make
space for new data.
# `enableFullCollectionMode`
Overrides all sampling configurations and enables full data collection for all sessions. Use this option for debugging
and testing purposes. Defaults to `false`. Use this option with caution as it can lead to high data collection and
storage costs if done at scale in production.
## `enableDiagnosticMode`
Enables diagnostic mode, which writes all internal Measure SDK logs to files on disk. These files can
be attached when reporting a bug to help us debug SDK issues. Defaults to `false`.
> [!WARNING]
> These files contain only Measure SDK logs, not your app's logs. Enable this option in debug builds
> only.
The log file location and the steps to retrieve them differ per platform. The
[Enable Diagnostic Mode](https://measure.sh/docs/../sdk-integration-guide) section of the
integration guide has the full step-by-step workflow.
#### Android
To pull all log files from the device to your machine:
```shell
adb shell "run-as tar czf - files/measure/sdk_debug_logs/" > sdk_debug_logs.tar.gz
```
To delete all log files:
```shell
adb shell run-as rm -rf files/measure/sdk_debug_logs/
```
#### iOS
Enable the `enableDiagnosticMode` and `enableDiagnosticModeGesture` options to `true` to enable a two-finger double tap gesture
for sharing logs via the share sheet.
```swift
let config = BaseMeasureConfig(enableDiagnosticMode: true, enableDiagnosticModeGesture: true)
Measure.initialize(with: clientInfo, config: config)
```
# Remote Configuration Options
A number of configuration options are available remotely from the Measure dashboard. Changes take effect without
releasing a new app version. To change the remote configuration settings, navigate to the "Apps" tab in the
Measure dashboard.
The SDK requests this configuration and caches it locally. For a new configuration to take effect, it takes
two app launches. First, the SDK fetches the new configuration and caches it locally. On the next app launch, the new
configuration takes effect.
#### Defaults
The following defaults are set for each app:
| Configuration | Default Value |
|--------------------------------------|-------------------------------------------------------------------------------------|
| Take screenshot on Crash | true |
| Crash session timeline duration | 300 seconds (5 minutes) |
| Take screenshot on ANR | true |
| ANR session timeline duration | 300 seconds (5 minutes) |
| Bug Report session timeline duration | 300 |
| Trace sampling rate | 0.01% |
| Journey sampling rate | 0.01% |
| Launch Metrics sampling rate | 0.01% |
| Disable HTTP event for URLs | (empty) |
| Track HTTP request body for URLs | (empty) |
| Track HTTP response body for URLs | (empty) |
| Blocked HTTP headers | Authorization, Cookie, Set-Cookie, Proxy-Authorization, WWW-Authenticate, X-Api-Key |
| Screenshot mask level | AllTextAndMedia |
## Crash Reporting
### Enable/Disable Screenshots
Each Crash, by default comes with a screenshot of the app at the time of the crash. You can choose to disable
this feature if you do not want screenshots to be captured.
### Session timeline duration
When a crash occurs, a session timeline _up to a few minutes_ leading up to the crash is captured. You can configure
this duration to control the number of events collected in each session timeline.
By default, _5 minutes_ of events before the crash are captured in the session timeline. You can adjust this duration
to control the amount of data collected.
## ANR Reporting
### Enable/Disable Screenshots
Each ANR, by default comes with a screenshot of the app at the time of the ANR. You can choose to disable
this feature if you do not want screenshots to be captured.
### Session timeline duration
When an ANR occurs, a session timeline _up to a few minutes_ leading up to the ANR is captured. You can configure
this duration to control the number of events collected in each session timeline.
By default, _5 minutes_ of events before the ANR are captured in the session timeline. You can adjust this duration
to control the amount of data collected.
## Bug Reports
### Session timeline duration
When a bug report is submitted, a session timeline _up to a few minutes_ leading up to the bug report is captured.
You can configure this duration to control the number of events collected in each session timeline.
By default, _5 minutes_ of events before the bug report are captured in the session timeline. You can adjust this
duration to control the amount of data collected.
## Trace Sampling
By default, 0.01% (1 in 10000) traces are reported. You can adjust this percentage from 0.001% to 100% to control
the amount of data collected.
## Launch Metrics Sampling
Launch metrics include Cold Launch, Warm Launch and Hot Launch metrics shown on the Overview page on the dashboard. A
sampling rate can be configured to control the number of sessions for whom these launch metrics are collected.
By default, 0.01% (1 in 10000) of sessions will have launch metrics collected. You can adjust this percentage
from 0.001% to 100% to control the amount of data collected.
## Journey Sampling
Journey events are used to construct the Journey view in the Measure dashboard. Journey events include Activity
Lifecycle events, Fragment Lifecycle events and Screen View events. A sampling rate can be configured to control
the number of sessions for whom these Journey events are collected.
By default, 0.01% (1 in 10000) of sessions will have Journey events collected. You can adjust this percentage from
0.001% to 100% to control the amount of data collected.
## HTTP Events
HTTP events contain information about network requests made by your app. The following configuration options are
available
for HTTP events:
### HTTP Events Sampling
> [!NOTE]
> Required minimum SDK versions: Android 0.16.1 and iOS 0.9.2
A sampling rate can be configured to control how often HTTP events are collected.
By default, 0.01% (1 in 10000) of HTTP events are collected. You can adjust this percentage from
0.001% to 100% to control the amount of data collected.
### Enable/Disable HTTP events
You can choose to enable or disable the collection of HTTP events by providing a URL. We support both exact URL matches
and wildcard URL matches (using `*` as a wildcard character).
Examples:
- Disable a specific endpoint: `https://example.com/api/v1/users`
- Disable a domain and all its endpoints: `https://example.com/*`
- Disable a specific path across all domains: `*/api/v1/orders`
- Disable a specific URL path: `https://example.com/api/*/payments`
### Enable Request Body Collection
By default, request body and headers are not collected for HTTP events. Note that enabling request body collection
should only be done for very specific URLs which do not contain sensitive information and the payload size is not too
large.
You can provide a list of URLs with wildcards for which request body and headers should be collected. We support both
exact URL matches and wildcard URL matches (using `*` as a wildcard character).
### Enable Response Body Collection
By default, response body and headers are not collected for HTTP events. Note that enabling response body collection
should only be done for very specific URLs which do not contain sensitive information and the payload size is not too
large.
You can provide a list of URLs with wildcards for which response body and headers should be collected. We support both
exact URL matches and wildcard URL matches (using `*` as a wildcard character).
### Headers Blocklist
Request and response headers are only collected if Request or Response Body Collection is enabled for a URL. By default,
no headers are collected.
This configuration allows you to specify which headers should be not collected for requests and responses. You can
provide a list of header names to be blocked. Header name matching is case-insensitive.
By default, the following headers are never collected, even if not specified in the blocklist:
- Authorization
- Cookie
- Set-Cookie
- Proxy-Authorization
- WWW-Authenticate
- X-Api-Key
## Screenshot Mask Level
Change the masking level of screenshots collected with Crashes and ANRs. It helps prevent sensitive
information from leaking.
> [!NOTE]
> _The mask level configuration does not apply to SwiftUI screens._
> Because of the way SwiftUI renders its views, all SwiftUI content is masked by default regardless of
> the mask level setting. See [Screenshot Masking for SwiftUI](https://measure.sh/docs/feature-screenshot-masking-swiftui)
> for details on how to control masking for SwiftUI views using the `.msrMask()` and `.msrUnmask()`
> modifiers.
The following levels of masking can be applied to the screenshots:
#### Mask all text and media
Masks all text, buttons, input fields, image views and video.
Example:

#### Mask all text
Masks all text, buttons & input fields.
Example:

#### Mask text except clickable
Masks all text & input fields except clickable views like buttons.
Example:

#### Mask sensitive input fields
Masks sensitive input fields like password, email & phone fields.
Example:

---
Source: https://measure.sh/docs/features/performance-impact
---
# Performance Impact
See the platform-specific sections below for details on the performance impact of the Measure SDK on your app.
* [**Android**](#android)
* [Benchmarks](#benchmarks)
* [Profiling](#profiling)
* [Comparison to Firebase initialization](#comparison-to-firebase-initialization)
* [**iOS**](#ios)
## Android
### Benchmarks
We benchmark the SDK's performance impact using a Pixel 4a running Android 13 (API 33). Each test runs 35 times using
macro-benchmark. For detailed methodology, see [android/measure-android/benchmarks](https://measure.sh/docs/../../android/measure-android/benchmarks).
> [!IMPORTANT]
> Benchmark results are specific to the device and the app. It is recommended to run the benchmarks
> for your app to get results specific to your app. These numbers are published to provide
> a reference point and are used internally to detect any performance regressions.
Benchmarks results for v0.16.0:
* Adds 17.5ms-31.3ms (24.3ms median) to the app startup time (Time to Initial Display) for a simple app.
* Adds 0.6-1ms to detect and create a layout snapshot for click gestures.
### Profiling
To measure the SDK's impact on your app, we've added traces to key areas of the code. These traces help you track
performance
using [Macro Benchmark](https://developer.android.com/topic/performance/benchmarking/macrobenchmark-overview)
or by using [Perfetto](https://perfetto.dev/docs/quickstart/android-tracing) directly.
Here's the table:
| Metric | Description |
|-----------------------------|---------------------------------------------------------------------------------------------------------|
| `msr-init` | Time spent on the **main** thread while initializing |
| `msr-start` | Time spent on the **main** thread when `Measure.start` is called |
| `msr-stop` | Time spent on the **main** thread when `Measure.stop` is called |
| `msr-trackEvent` | Time spent in storing an event to local storage. Almost all of this time is spent _off_ the main thread |
| `msr-trackGesture` | Time spent on the **main** thread to track a gesture |
| `msr-generateSvgAttachment` | Time spent on **background** thread to generate an SVG layout |
| `msr-captureScreenshot` | Time spent on **main** thread to capture and compress a screenshot |
| `msr-loadImageFromFile` | Time spent on **main** thread to load an image from a file |
| `msr-loadImageFromUri` | Time spent on **main** thread to load an image from a Uri |
### Comparison to Firebase initialization
The following are the results from running a macro-benchmark test to compare initialization
time of Measure SDK vs Firebase. Tested with firebase BOM version `33.7.0` and
Measure Android SDK version `0.10.0` running on a Pixel 4a.
Firebase initializes in multiple phases. The total median time to initialize when running the
benchmark for an app with Firebase crashlytics, performance and analytics SDK
was observed as `77.6ms`. While Measure took `35.0ms` in the same macro-benchmark test.

Perfetto screenshot from one of the runs:

## iOS
## Benchmarks
We benchmarked the iOS SDKs performance impact using a baseline app on an iPhone 14 Plus
running iOS 18.5. Each scenario was executed _5 times_ and instrumented with `os_signpost` for
precise time tracking. Metrics were collected via Instruments (Time Profiler and Logging with
Signposts).
> [!IMPORTANT]
> Performance impact varies based on device and application complexity.
> We recommend measuring impact in your specific app.
> The following numbers serve as a reference baseline and are used internally to monitor regressions.
### Benchmark Results (v0.6.0)
Measure adds **21.03–25.7 ms (avg ~22.8 ms)** to app startup time (Time to Initial Display). Other
key operations performed by the SDK can be found below:
| Operation | p95 | Description |
|---------------------------|-----------|---------------------------------------------------------------|
| `trackEvent` | 195 µs | Includes event collection, attribute enrichment and queueing |
| `appendAttributes` | 360 µs | Dynamic attribute gathering (e.g., network, device state) |
| `trackBugReport` | 120 µs | Complete flow including screenshot, layout and metadata |
| `trackEventUserTriggered` | 32 µs | User-triggered event tracking |
| `trackSpanTriggered` | 96 µs | When a trace event is emitted |
| `spanProcessorOnStart` | 105 µs | Span construction |
| `spanProcessorOnEnded` | 355 µs | Span serialization and buffering |
| `generateScreenshot` | 80 ms | Snapshotting and compression of UI |
| `generateLayoutSnapshot` | 7.5 ms | Layout hierarchy capture |
---
Source: https://measure.sh/docs/sdk-upgrade-guides
---
# SDK Upgrade Guides
These docs contains detailed information about any breaking changes or behavior changes that you should be aware of when upgrading to a new version of the SDK. The guides are only created for versions that have non-trivial breaking changes or behavior changes. For minor releases that do not have any breaking changes or behavior changes, we recommend checking the release notes for more details.
- [Android SDK v0.16.0](https://measure.sh/docs/android-v0.16.0)
- [iOS SDK v0.9.0](https://measure.sh/docs/ios-v0.9.0)
- [Measure Flutter SDK v0.4.0](https://measure.sh/docs/measure_flutter-v0.4.0)
---
Source: https://measure.sh/docs/sdk-upgrade-guides/android-v0.16.0
---
# Upgrading to Android SDK v0.16.0
## Breaking Changes
#### **Changes to MeasureConfig**
https://github.com/measure-sh/measure/pull/3069
The following properties from `MeasureConfig` have been removed and can be controlled directly from the dashboard from "Settings -> Apps -> Data Control"
- `trackScreenshotOnCrash`
- `screenshotMaskLevel`
- `trackHttpBody`
- `httpHeadersBlocklist`
- `httpUrlBlocklist`
- `httpUrlAllowlist`
- `traceSamplingRate`
- `coldLaunchSamplingRate`
- `warmLaunchSamplingRate`
- `hotLaunchSamplingRate`
- `journeySamplingRate`
`trackHttpHeaders` is completely removed. To control the tracking of HTTP headers, you can use the dashboard to
enable/disable request or response body tracking which also controls the tracking of HTTP headers.
`samplingRateForErrorFreeSessions` has been removed. A new flag called `enableFullCollectionMode` has been added
to `MeasureConfig` which when enabled, will collect all events and spans by ignoring all sampling rates set on the
dashboard. This can be used if you want to collect all events without sampling. Typically useful in debug builds.
For more details, checkout the [configuration options](https://measure.sh/docs/../features/configuration-options) documentation.
## Behavior Changes
#### **Improved Span validation**
https://github.com/measure-sh/measure/pull/3081
Span name and attribute validations have been made stricter in accordance to the limits mentioned in the
[documentation](https://measure.sh/docs/../features/feature-performance-tracing). If a span name exceeds the maximum allowed length, it
will be discarded. While, if an attribute key name exceeds the maximum allowed length, the attribute will be discarded.
A log message will be printed in both cases to help identify the issue during development. Earlier these would get
discarded silently on the server with no feedback during development.
#### **Session timeline duration**
https://github.com/measure-sh/measure/pull/3069
For older versions, the SDK would report all events for a session when a crash, ANR or bug report was encountered. For
very long sessions, this led to a lot of unnecessary events being reported which made it harder to get to the root cause.
With this release, the SDK will only report events that occurred within a certain time window before the crash, ANR or
bug report. This time window is configurable from the dashboard and can be set to a value can be configured in seconds
to a max of 3600 seconds (1 hour). The default value is 300 seconds (5 minutes).
#### **Addition of Baseline Profiles**
https://github.com/measure-sh/measure/pull/3096
Baseline profiles are now shipped with the SDK which should help reduce the impact on app startup times. This should not
lead to any issues; however, we suggest testing the app with R8 enabled to identify any issues during startup.
---
Source: https://measure.sh/docs/sdk-upgrade-guides/ios-v0.9.0
---
# Upgrading to iOS SDK v0.9.0
## Breaking Changes
#### **Changes to MeasureConfig**
https://github.com/measure-sh/measure/pull/3077
The following properties from `MeasureConfig` have been removed and can be controlled directly from the dashboard from "Settings -> Apps -> Data Control"
- `trackScreenshotOnCrash`
- `screenshotMaskLevel`
- `trackHttpBody`
- `httpHeadersBlocklist`
- `httpUrlBlocklist`
- `httpUrlAllowlist`
- `traceSamplingRate`
- `coldLaunchSamplingRate`
- `warmLaunchSamplingRate`
- `hotLaunchSamplingRate`
- `journeySamplingRate`
`trackHttpHeaders` is completely removed. To control the tracking of HTTP headers, you can use the dashboard to
enable/disable request or response body tracking which also controls the tracking of HTTP headers.
`samplingRateForErrorFreeSessions` has been removed. A new flag called `enableFullCollectionMode` has been added
to `MeasureConfig` which when enabled, will collect all events and spans by ignoring all sampling rates set on the
dashboard. This can be used if you want to collect all events without sampling. Typically useful in debug builds.
For more details, checkout the [configuration options](https://measure.sh/docs/../features/configuration-options) documentation.
## Behavior Changes
#### **Improved Span validation**
https://github.com/measure-sh/measure/pull/3077
Span name and attribute validations have been made stricter in accordance to the limits mentioned in the
[documentation](https://measure.sh/docs/../features/feature-performance-tracing). If a span name exceeds the maximum allowed length, it
will be discarded. While, if an attribute key name exceeds the maximum allowed length, the attribute will be discarded.
A log message will be printed in both cases to help identify the issue during development. Earlier these would get
discarded silently on the server with no feedback during development.
#### **Session timeline duration**
https://github.com/measure-sh/measure/pull/3077
For older versions, the SDK would report all events for a session when a crash, ANR or bug report was encountered. For
very long sessions, this led to a lot of unnecessary events being reported which made it harder to get to the root cause.
With this release, the SDK will only report events that occurred within a certain time window before the crash, ANR or
bug report. This time window is configurable from the dashboard and can be set to a value can be configured in seconds
to a max of 3600 seconds (1 hour). The default value is 300 seconds (5 minutes).
---
Source: https://measure.sh/docs/sdk-upgrade-guides/measure_flutter-v0.4.0
---
# Upgrading to Measure Flutter SDK v0.4.0
## Breaking Changes
#### **Changes to MeasureConfig**
https://github.com/measure-sh/measure/pull/3090
The following properties from `MeasureConfig` have been removed and can be controlled directly from the dashboard from "Settings -> Apps -> Data Control"
- `trackScreenshotOnCrash`
- `trackHttpBody`
- `httpHeadersBlocklist`
- `httpUrlBlocklist`
- `httpUrlAllowlist`
- `traceSamplingRate`
- `coldLaunchSamplingRate`
- `warmLaunchSamplingRate`
- `hotLaunchSamplingRate`
- `journeySamplingRate`
`trackHttpHeaders` is completely removed. To control the tracking of HTTP headers, you can use the dashboard to
enable/disable request or response body tracking which also controls the tracking of HTTP headers.
`samplingRateForErrorFreeSessions` has been removed. A new flag called `enableFullCollectionMode` has been added
to `MeasureConfig` which when enabled, will collect all events and spans by ignoring all sampling rates set on the
dashboard. This can be used if you want to collect all events without sampling. Typically useful in debug builds.
`autoInitializeNativeSDK` has been removed. The native iOS and Android SDKs **must** be initialized manually. Read more
about it in the [SDK initialization guide](https://measure.sh/docs/../sdk-integration-guide) documentation.
For more details, checkout the [configuration options](https://measure.sh/docs/../features/configuration-options) documentation.
## Behavior Changes
#### **Session timeline duration**
https://github.com/measure-sh/measure/pull/3090
For older versions, the SDK would report all events for a session when a crash, ANR or bug report was encountered. For
very long sessions, this led to a lot of unnecessary events being reported which made it harder to get to the root cause.
With this release, the SDK will only report events that occurred within a certain time window before the crash, ANR or
bug report. This time window is configurable from the dashboard and can be set to a value can be configured in seconds
to a max of 3600 seconds (1 hour). The default value is 300 seconds (5 minutes).
#### **Layout Snapshots**
https://github.com/measure-sh/measure/pull/2751
[Layout Snapshots](https://measure.sh/docs/../features/feature-gesture-tracking) are now available for Flutter along with
a new `measure_build` package that can be used to enhance the layout snapshots with widgets declared in your
app. To learn more checkout the `measure_build` package [documentation](https://measure.sh/docs/../../flutter/packages/measure_build).
---
Source: https://measure.sh/docs/hosting
---
# Self Hosting Guide
This guide helps you to self-host measure.sh on your own infrastructure. We recommend self hosting for small scale and hobby projects.
Self hosting incorrectly at scale can lead to data loss, security issues and downtime. Our self host install script is designed for single machine setups.
For distributed, secure and scalable hosting, we recommend our [hosted cloud](https://measure.sh).
## Contents
- [Objectives](#objectives)
- [Prerequisites](#prerequisites)
- [System Requirements](#system-requirements)
- [Deploy on a Linux virtual machine](#deploy-on-a-linux-virtual-machine)
- [1. SSH into your VM](#1-ssh-into-your-vm)
- [2. Clone the measure repo](#2-clone-the-measure-repo)
- [3. Run the `install.sh` script](#3-run-the-installsh-script)
- [4. Configure and start your self hosted measure instance](#4-configure-and-start-your-self-hosted-measure-instance)
- [5. Setup a reverse proxy server](#5-setup-a-reverse-proxy-server)
- [6. Setup DNS A records](#6-setup-dns-a-records)
- [7. Access your measure.sh dashboard](#7-access-your-measuresh-dashboard)
- [Upgrade a Self Hosted Installation](#upgrade-a-self-hosted-installation)
- [Run on macOS locally](#run-on-macos-locally)
- [System Requirements](#system-requirements-1)
- [1. Clone the measure repo](#1-clone-the-measure-repo)
- [2. Run `config.sh` script to configure](#2-run-configsh-script-to-configure)
- [3. Start the containers](#3-start-the-containers)
- [4. Access your Measure dashboard](#4-access-your-measure-dashboard)
- [Frequently Asked Questions](#frequently-asked-questions)
- [Q. Can I use podman instead of docker?](#q-can-i-use-podman-instead-of-docker)
- [Q. I made some mistake and want to start the installation over?](#q-i-made-some-mistake-and-want-to-start-the-installation-over)
- [Q. How to perform healthcheck of Measure services?](#q-how-to-perform-healthcheck-of-measure-services)
- [Q. Can I host Measure behind a VPN?](#q-can-i-host-measure-behind-a-vpn)
- [Q. I'm using nginx as a reverse proxy. What configurations should I change?](#q-im-using-nginx-as-a-reverse-proxy-what-configurations-should-i-change)
- [Q. How to add or update environment variables?](#q-how-to-add-or-update-environment-variables)
- [Q. How to setup complete symbolication for iOS?](#q-how-to-setup-complete-symbolication-for-ios)
- [Q. Why does ClickHouse consume high amount of CPU or memory?](#q-why-does-clickhouse-consume-high-amount-of-cpu-or-memory)
## Objectives
- Self host measure on a single VM instance
- Install and configure `caddy` as a reverse proxy
- Create and configure a Google OAuth application
- Create and configure a GitHub OAuth application
## Prerequisites
- Basic terminal/command line skills
- Basic text editor skills
- SSH access to a Cloud VM instance
- Ability to add DNS A records on your primary domain
- Ability to run commands with `sudo`
- `git` in your PATH
- External IP of the VM
## System Requirements
- x86-64/amd64 Linux Virtual Machine
- Any one of the following supported Linux distributions
- Ubuntu 24.04 LTS
- Debian 12 (Bookworm)
- At least 4 vCPUs
- At least 16 GB RAM
- At least 100 GB of boot disk volume
- Port `80` and `443` opened in firewall settings
## Deploy on a Linux virtual machine
Follow these step-by-step instructions to deploy measure.sh on a single Linux VM instance.
### 1. SSH into your VM
Deploy a Linux VM meeting the above system requirements on any popular Cloud hosting provider like Google Cloud Platform, AWS or DigitalOcean. Once the machine is up and running, SSH into it following your cloud provider's instructions.
### 2. Clone the measure repo
Let's start by moving to your home directory.
```sh
cd ~
```
Choose a git tag. You can find out the latest stable release tag from the [releases](https://github.com/measure-sh/measure/releases) page.
> [!IMPORTANT]
>
> Always choose a tag matching the format `v[MAJOR].[MINOR].[PATCH]`, for example: `v1.2.3`.
> These tags are tailored for self host deployments.
Clone the repository with git and change to the `measure` directory. Replace `GIT-TAG` with your chosen git tag.
```sh
git clone https://github.com/measure-sh/measure.git -b GIT-TAG && cd measure
```
### 3. Run the `install.sh` script
Next, change into the `self-host` directory. All successive commands will be run from this directory.
```sh
cd self-host
```
Run the install script with `sudo`.
```sh
sudo ./install.sh
```
> [!NOTE]
>
> To use **podman** instead of **docker**, use the *--podman* flag.
>
> ```sh
> sudo ./install.sh --podman
> ```
>
> This would install the following packages.
> - [podman](https://podman.io/)
> - [podman-docker](https://packages.debian.org/bookworm/podman-docker)
> - [podman-compose](https://github.com/containers/podman-compose)
> - [docker-compose](https://github.com/docker/compose)
>
> You can continue to use regular docker commands like, `docker ps -a` or `docker compose ps -a`. It should work seamlessly.
The measure.sh install script will check your system's requirements and start the installation. It can take a few minutes to complete.
### 4. Configure and start your self hosted measure instance
During installation, you'll be presented with the Measure configuration wizard.
For the first prompt, it'll ask for a namespace for your company or team. This typically will be your company or team's name. If trying out individually, feel free to set any name.

For the next prompt, you'll be asked to enter the URL to access measure.sh's web dashboard. Typically, this might look like a subdomain on your primary domain, for example, if your domain is `yourcompany.com`, enter `https://measure.yourcompany.com`.
Next, you'll be asked to enter the URL to access Measure's REST API & Ingest endpoint. Typically, this might look like, `https://measure-api.yourcompany.com` & `https://measure-ingest.yourcompany.com` respectively.

Later in this guide, you'll be setting DNS A records for the above subdomains you entered. For now, let's move on to the next prompt.
For the next few prompts, you'll need to obtain a Google & GitHub OAuth Application's credentials. This is required to setup authentication in measure.sh dashboard. Follow the below links to obtain Google & GitHub OAuth credentials.
- [Create a Google OAuth App](https://measure.sh/docs/google-oauth)
- [Create a GitHub OAuth App](https://measure.sh/docs/github-oauth)
Once you have created the above apps, copy the key and secrets and enter in the relevant prompts.
Next, you'll need to set up an SMTP email provider. This is used to send emails for team invites, alerts & so on. Follow the below link to obtain SMTP credentials:
- [Set up SMTP email provider](https://measure.sh/docs/smtp-email)
Once your provider is set up, copy the values and enter in the relevant prompts.
Optionally, you can set up a Slack app if you want to receive alert notifications in your Slack workspace. Follow the below link to create and configure a Slack app:
- [Set up Slack Integration](https://measure.sh/docs/slack)
Once your slack integration is set up, copy the values and enter in the relevant prompts. If you wish to ignore it, enter empty values and proceed.
Once completed, the install script will attempt to start all the Measure docker compose services. You should see a similar output.

At this point, all the services should be up, but they are not reachable from the internet. To make sure these services can serve traffic, let's setup:
- A reverse proxy using [caddy](https://caddyserver.com/)
- Setup DNS A records on your domain
### 5. Setup a reverse proxy server
While we recommend [caddy](https://caddyserver.com) for routing incoming requests to the correct destinations. You can setup any other reverse proxy server of your choice, like [nginx](https://nginx.org/) or [traefik](https://traefik.io/). We chose Caddy because it's relatively straightforward to setup and comes with great defaults.
For now, let's setup caddy.
Change to your home directory.
```sh
cd ~
```
Run the following commands to install caddy.
```sh
sudo apt install -y debian-keyring debian-archive-keyring apt-transport-https curl && \
curl -1sLf 'https://dl.cloudsmith.io/public/caddy/stable/gpg.key' | sudo gpg --dearmor -o /usr/share/keyrings/caddy-stable-archive-keyring.gpg && \
curl -1sLf 'https://dl.cloudsmith.io/public/caddy/stable/debian.deb.txt' | sudo tee /etc/apt/sources.list.d/caddy-stable.list && \
sudo apt update && \
sudo apt install caddy
```
If you are not installing on Ubuntu or Debian, please follow the guide on Caddy's [installation page](https://caddyserver.com/docs/install) and come back here when caddy is installed.
Create a basic `~/Caddyfile` config by running the following.
```sh
cat < ~/Caddyfile
measure.yourcompany.com {
reverse_proxy http://localhost:3000
}
measure-api.yourcompany.com {
reverse_proxy http://localhost:8080
}
measure-ingest.yourcompany.com {
reverse_proxy http://localhost:8085
}
EOF
```
> [!NOTE]
>
> In the above Caddyfile, we have used the example domains from above, but make sure you replace with your actual domain names.
Next, reload caddy to make sure caddy picks up our newly generated config.
```sh
caddy reload
```
### 6. Setup DNS A records
For this last step, we'll setup 2 DNS A records and put those subdomains to work. First, obtain your VM's external IP address. Let's say, the external IP is `101.102.103.104`.
Go to your domain hosting provider and add A records for the following subdomains.
```
measure.yourcompany.com IN A 101.102.103.104
measure-api.yourcompany.com IN A 101.102.103.104
measure-ingest.yourcompany.com IN A 101.102.103.104
```
Depending on your domain provider, it might take a few minutes to couple of hours for the above DNS records to take effect.
### 7. Access your measure.sh dashboard
Visit `https://measure.yourcompany.com` to access your dashboard and sign in to continue. Replace `yourcompany.com` with your domain.
## Upgrade a Self Hosted Installation
To upgrade to a specific or latest version of measure.sh, SSH to your VM instance first and run these commands.
For certain target versions, you will need to run extra migration scripts. Check out our [Migration Guides](https://measure.sh/docs/../hosting/migration-guides).
```sh
# change to the directory you
# had cloned to.
cd ~/measure
```
Find out the suitable version from the [list of release tags](https://github.com/measure-sh/measure/releases). **We recommend sticking to the latest stable release.**
> [!IMPORTANT]
>
> Always choose a tag matching the format `v[MAJOR].[MINOR].[PATCH]`, for example: `v1.2.3`.
> These tags are tailored for self host deployments.
Run `git fetch --tags` to fetch all tags.
```sh
git reset --hard # reset local modifications, if any
git fetch --tags
```
> [!NOTE]
>
> To see which tag you are on, run: `git describe --tags --always` from `self-host` directory.
Checkout to a particular git tag.
```sh
# replace `v1.2.3` with the suitable git tag
git checkout v1.2.3
```
Change to `self-host` directory and run `sudo ./install.sh` to perform the upgrade.
```sh
# change to `self-host` directory
cd self-host
# run the `install.sh` script
sudo ./install.sh
```
It'll take a few minutes for the upgrade to complete.
> [!NOTE]
>
> Please note that an upgrade may not happen smoothly because of incompatible changes or configuration mismatches. If you face any issues while upgrading or need advice, please do not hesitate to [open an issue](https://github.com/measure-sh/measure/issues/new/choose) or to drop a message on our [Discord](https://discord.gg/f6zGkBCt42).
## Run on macOS locally
You can run measure.sh locally on macOS for trying it out quickly, but keep in mind that not all features may work as expected on macOS.
> [!WARNING]
>
> ### macOS Compatibility
>
> Not all features on macOS may work as expected. Don't use this setup for production. This guide was tested on macOS 14.6, though older or newer versions of macOS may work too.
>
> ### Using Podman on macOS
>
> Podman on macOS runs containers inside a virtual machine. Make sure to allocate sufficient memory (at least 8 GB)
> to the podman machine. Low memory may crash the application or lead to instability.
### System Requirements
Make sure the following requirements are met before proceeding.
| Name | Version |
| -------------- | -------- |
| Docker | v26.1+ |
| Podman | v5.0.3+ |
| Docker Compose | v2.27.3+ |
| node | v20+ |
### 1. Clone the measure repo
Choose a git a tag to use. You can find out the latest stable release tag from the [releases](https://github.com/measure-sh/measure/releases) page.
> [!IMPORTANT]
>
> Always choose a tag matching the format `v[MAJOR].[MINOR].[PATCH]`, for example: `v1.2.3`.
> These tags are tailored for self host deployments.
Clone the repository with git and change to the `measure` directory. Replace `GIT-TAG` with your chosen git tag.
```sh
git clone https://github.com/measure-sh/measure.git -b GIT-TAG && cd measure/self-host
```
### 2. Run `config.sh` script to configure
Run the `config.sh` script to auto configure most settings.
```sh
./config.sh
```
> [!NOTE]
>
> For production usage, use the *--production* flag.
>
> ```sh
> ./config.sh --production
> ```
To continue, you'll need to obtain a Google & GitHub OAuth Application's credentials. This is required to setup authentication in Measure dashboard. Follow the below links to obtain Google & GitHub OAuth credentials.
- [Create a Google OAuth App](https://measure.sh/docs/google-oauth)
- [Create a GitHub OAuth App](https://measure.sh/docs/github-oauth)
Once you have created the above apps, copy the key and secrets and enter them in the relevant prompts.
Next, you'll need to set up an SMTP email provider. This is used to send emails for team invites, alerts & so on. Follow the below link to obtain SMTP credentials:
- [Set up SMTP email provider](https://measure.sh/docs/smtp-email)
Once your provider is set up, copy the values and enter them in the relevant prompts.
### 3. Start the containers
To start the containers in production mode, run.
```sh
docker compose -f compose.yml -f compose.prod.yml \
--profile migrate \
up --build
```
It'll take a few seconds for the containers to be healthy.
### 4. Access your Measure dashboard
Visit [Dashboard](http://localhost:3000/auth/login) to access your dashboard and sign in to continue.
## Frequently Asked Questions
Typical questions asked by other self host-ers.
### Q. Can I use podman instead of docker?
Yes, you can. Use the `--podman` flag when running the installation script.
```sh
sudo ./install.sh --podman
```
You can administer the instance using docker and docker compose commands as if you were using docker.
### Q. I made some mistake and want to start the installation over?
If you want to start over the installation from a clean slate, do the following.
1. **Run the following from the `self-host` directory**
```sh
sudo docker compose down --rmi all --remove-orphans --volumes
```
2. **Remove the cloned `measure` directory**
```sh
rm -rf ~/measure
```
3. **Repeat the installation process from start**
### Q. How to perform healthcheck of Measure services?
To perform health check for the API service, use:
```sh
curl -s https://measure.yourcompany.com | grep measure
# local environment
curl -s http://localhost:3000 | grep measure
```
To perform health check for the Dashboard service, use:
```sh
curl -s https://measure-api.yourcompany.com/ping | grep pong
# local environment
curl -s http://localhost:8080/ping | grep pong
```
To perform health check for the Ingest service, use:
```sh
curl -s https://measure-ingest.yourcompany.com/ping | grep pong
# local environment
curl -s http://localhost:8085/ping | grep pong
```
Replace the domain names accordingly. These health check endpoints are useful when defining Measure services as backends for a load balancer or proxy.
### Q. Can I host Measure behind a VPN?
Absolutely! Hosting Measure behind a VPN is a great way to shield it from public internet. Though, keep the following in mind.
1. **Measure API service must be accessible on public internet.** This allows the Measure SDK in your mobile app to communicate to the Measure backend.
2. **Measure Dashboard service must bind on the private address.** Typically, proxy servers will listen on all network interfaces. When hosting behind a VPN, make sure to bind the Dashboard service on a private IP only. This is essential to achieve network level isolation. For example, the Caddy configuration would look like:
```
measure.yourcompany.com {
# listen only on private IP
# change the IP accordingly
bind 10.0.0.1
reverse_proxy http://localhost:3000
}
measure-api.yourcompany.com {
reverse_proxy http://localhost:8080
}
measure-ingest.yourcompany.com {
reverse_proxy http://localhost:8085
}
```
[Read more on `bind`.](https://caddyserver.com/docs/caddyfile/directives/bind)
In the above setup, only authorized VPN users will be able to access the Measure Dashboard, without disrupting ingestion of events coming from Measure SDKs.
### Q. I'm using nginx as a reverse proxy. What configurations should I change?
When using nginx, configure the following directives.
- **`client_max_body_size`**. Set it to sufficiently large like `1024M` (1 GiB) to ensure large debug mapping files, like proguard & dSYM file uploads will succeed.
- **`ignore_invalid_headers`**. Set this to `off`, otherwise uploading builds or mapping files like proguard & dSYM files may fail.
```
server {
# other configuration
client_max_body_size 1024M;
ignore_invalid_headers off;
# other configuration
}
```
### Q. How to add or update environment variables?
All configuration variables are defined in the `self-host/.env` file. For the updated configuration to take effect, shutdown & start compose services.
To do that, run from inside the `self-host` directory.
```sh
sudo docker compose -f compose.yml -f compose.prod.yml \
--profile migrate \
down
```
Then run the `./install.sh` script.
```sh
sudo ./install.sh
```
### Q. How to setup complete symbolication for iOS?
To symbolicate iOS frames for system frameworks, you would need to obtain a Google Drive API key & do the following:
1. Update & save the `DRIVE_API_KEY` environment variable in `self-host/.env`
2. Restart the `symboloader` service by running
```sh
docker compose down symboloader
docker compose up -d symboloader
```
3. Run symboloader's sync command, like this
```sh
docker compose exec symboloader symboloader \
sync \
--versions "last 5 versions"
```
Few things to note:
- iOS system symbol files can occupy a lot of disk space. Make sure you have at least 500 GB additional disk space capacity.
- You may be rate-limited by Google Drive if you receive a 403 error: _We're sorry... but your computer or network may be sending automated queries_. When this happens, retry after 24 hours.
[Read about the symboloader CLI commands](https://measure.sh/docs/../../backend/symboloader)
### Q. Why does ClickHouse consume high amount of CPU or memory?
ClickHouse is engineered to maximize hardware utilization, often leading to high CPU and memory consumption. In an idle state, when Measure is not ingesting sessions or executing queries, you might observe 25-30% CPU consumption. Under higher load, CPU consumption may go up to 90-100%. This is completely normal and expected behavior.
Several factors contribute to this behavior.
1. **Query Execution and Parallelism**: ClickHouse executes queries using multiple threads to enhance performance. By default, it utilizes a number of threads equal to the number of available CPU cores.
2. **Background Merges and Mutations**: ClickHouse continuously merges data parts in the background to optimize storage and query performance. These merge operations and data mutations can lead to increased resource consumption.
3. **Compression and Decompression**: ClickHouse employs compression algorithms to minimize storage space. Compressing and decompressing data during ingestion and queries are CPU-intensive operations.
4. **Hardware Considerations**: ClickHouse is configured to utilize available resources effectively and expects adequate RAM (32 GB or more is recommended). Our default configuration is designed to strike a balance between cost and performance for majority of users. Feel free to allocate additional system resources if your budget allows.
Having said that, we'll continue to optimize our configuration and recommendation over time to accommodate light & heavy weight usage patterns whenever possible.
> [!NOTE]
>
> If you want to discuss more, hop on to our [Discord](https://discord.gg/f6zGkBCt42) and ask your questions.
#### References
1. [ClickHouse High CPU Usage](https://kb.altinity.com/altinity-kb-setup-and-maintenance/high-cpu-usage/)
2. [GitHub issue discussing mutations](https://github.com/ClickHouse/ClickHouse/issues/39403)
3. [ClickHouse Usage Recommendations](https://clickhouse.com/docs/en/operations/tips)
---
Source: https://measure.sh/docs/hosting/google-oauth
---
# Setup a Google OAuth Application
In this guide, we'll help you setup a Google OAuth app so that your users can login using their Google accounts on your Measure Web dashboard.
1. Visit [console.cloud.google.com](https://console.cloud.google.com)
2. Open the hamburger menu on top left and hover above **APIs & Services** and click on **OAuth consent screen** from the fly-out menu
3. On the next screen, choose User Type as **Internal**
4. Enter an appropriate app name and user support email
5. Add a logo of your company or team
6. Add the top-level domain of your company
7. Add a developer contact email
8. In the scopes screen, choose the following scopes and click **UPDATE**
1. `../auth/userinfo.email`
2. `../auth/userinfo.profile`
9. Click on **SAVE AND CONTINUE**
10. On the next screen, review all info and click on **BACK TO DASHBOARD** when done
11. On the left sidebar, click on **Credentials**
12. Click on the **+ CREATE CREDENTIALS** button and choose **OAuth client ID**
13. Select **Web application**
14. Enter a name for the application
15. Under **Authorized JavaScript origins**, enter your Measure dashboard URL (Example: https://measure.yourcompany.com). Replace `yourcompany.com` with your domain.
16. Under **Authorized redirect URIs**, enter the redirect URI in the following way: https://measure.yourcompany.com/auth/callback/google. Replace `yourcompany.com` with your domain.
17. Click **CREATE**
18. Copy the **Client ID** and the **Client Secret**
[Go back to self host guide](https://measure.sh/docs)
---
Source: https://measure.sh/docs/hosting/github-oauth
---
# Setup a GitHub OAuth Application
1. Visit your GitHub organization's settings page, located at https://github.com/organizations/YOUR-ORGANIZATION/settings/profile. Replace `YOUR-ORGANIZATION` with the name of your organization.
2. Locate **Developer Settings** at the bottom of the left sidebar and click on **OAuth Apps**
3. Click the **New Org OAuth App** button
4. Enter a name for your GitHub OAuth app
5. Enter the homepage URL, like: https://measure.yourcompany.com. Replace `yourcompany.com` with your domain.
6. Enter a suitable description of your app
7. Enter the following as the **Authorization callback URL** - https://measure.yourcompany.com/auth/callback/github. Replace `yourcompany.com` with your domain.
8. Click on **Register application** button to create the GitHub OAuth app
9. Click on **Generate a new client secret**
10. Copy the **Client ID** and paste when asked in prompt for `Enter GitHub OAuth app key`
11. Copy the **Client Secret** and paste when asked in prompt for `Enter GitHub OAuth app secret`
[Go back to self host guide](https://measure.sh/docs)
---
Source: https://measure.sh/docs/hosting/smtp-email
---
# Set up an SMTP email provider
Set up an email provider to get SMTP credentials. We recommend [Ethereal Mail](https://ethereal.email) for local development/testing and [Resend](https://resend.com), [SendGrid](https://sendgrid.com) or [AWS SES](https://aws.amazon.com/ses) for production.
Your email provider should let you configure the email domain that invite and alert notifications will use as the "from" address and give you the other SMTP credentials needed for the following steps.
If you do not provide an email domain, by default, Measure will use the SITE_ORIGIN varaiable where the dashboard is deployed as the "from" address.
## Configure SMTP email settings for existing users
If you are upgrading from v0.7.x, you would need to manually configure the SMTP settings.
1. Edit the `self-host/.env` file.
2. Add the following environment variables as obtained from your email provider.
```sh
SMTP_HOST=smtp.yourprovider.email # change this
SMTP_PORT=587 # change this
SMTP_USER=user@yourprovider.email # change this
SMTP_PASSWORD=some_secret_password # change this
EMAIL_DOMAIN=your_email_domain.com # change this
```
3. Run the following command to shutdown all services.
```sh
sudo docker compose \
-f compose.yml \
-f compose.prod.yml \
--profile migrate \
down
```
4. Finally, run the `install.sh` script for the configuration to take effect.
```sh
sudo ./install.sh
```
[Go back to self host guide](https://measure.sh/docs)
---
Source: https://measure.sh/docs/hosting/slack
---
# Set up Slack integration
Use this guide to setup Slack integration to receive Measure alert notifications on Slack.
## Contents
- [Configure Slack settings for new installation](#configure-slack-settings-for-new-installation)
- [Configure Slack settings for existing installation](#configure-slack-settings-for-existing-installation)
## Configure Slack settings for new installation
1. **Slack App**. Create a Slack app following the official [Slack guide](https://docs.slack.dev/quickstart/). You may choose any name, logo and description you wish for your app.
2. **Basic Information**. Go to `Basic Information` section and copy client id, client secret and signing secret and paste them into the prompts. (If you're upgrading an existing Measure installation you will paste these variables into your environment variables file. See section for existing users below)
3. **OAuth & Permissions**. Go to the `OAuth & Permissions` section of your app and under `Redirect URLs`, add your Measure Slack authentication callback URL. This should be something like `https://[measure.yourcompany.com]/auth/callback/slack`. Replace **`[measure.yourcompany.com]`** with your actual Measure Dashboard domain.
4. In the same `OAuth & Permissions` section of your app, under `Scopes`, request the following permissions:
- **channels:read**
- **chat:write**
- **groups:read**
- **commands**
5. **Slash Commands**. Go to `Slash Commands` section. Create the commands as follows:
> [!NOTE]
>
> Please note that you need to use the **Measure API domain** in the below step and not the Measure Dashboard domain.
>
> If this URL is incorrect, you'll get a `dispatch_failure` error when connecting your Measure Team to your Slack Workspace.
>
> Assuming your API domain is something like `measure-api.yourcompany.com`, you should put in something like `https://[measure-api.yourcompany.com]/slack/events` in the below step.
>
> Replace **`[measure-api.yourcompany.com]`** with your actual Measure API domain.
| Command | Request URL | Short Description |
| -------------------- | --------------------------------------------------------------------------------------------------------------------------------------------- | ------------------------------------------------------------------ |
| /subscribe-alerts | https://[measure-api.yourcompany.com]/slack/events
Replace **[measure-api.yourcompany.com]** with your actual Measure API domain. | Registers current channel to receive alert notifications |
| /stop-alerts | https://[measure-api.yourcompany.com]/slack/events
Replace **[measure-api.yourcompany.com]** with your actual Measure API domain. | Stops current channel from receiving alert notifications |
| /list-alert-channels | https://[measure-api.yourcompany.com]/slack/events
Replace **[measure-api.yourcompany.com]** with your actual Measure API domain. | Lists channels currently registered to receive alert notifications |
## Configure Slack settings for existing installation
If you are upgrading from v0.8.2 or below, you would need to manually update the environment variables. After you've followed the above steps, instead of entering the client id and secrets in a terminal prompt, you will need to edit your environment variables file and restart the services.
> [!NOTE]
>
> Slack cannot send event and OAuth callbacks to your local dev environments. In order to run and test Slack integration while developing or testing locally, you will need to use a tunneling service such as [ngrok](https://ngrok.com) or [Cloudflare tunnels](https://developers.cloudflare.com/cloudflare-one/networks/connectors/cloudflare-tunnel/) and use that URL to proxy to your localhost.
>
> See this [guide](https://docs.slack.dev/tools/node-slack-sdk/tutorials/local-development/#using-a-local-request-url-for-development) for more information.
1. **Slack Client Credentials**. Open the `self-host/.env` file & add the following environment variables as obtained from your Slack app page.
```sh
SLACK_CLIENT_ID=your-slack-client-id # change this
SLACK_CLIENT_SECRET=your-slack-client-secret # change this
SLACK_SIGNING_SECRET=your-slack-signing-secret # change this
```
2. **State Salt**. Generate a random 44 character salt. Use the command `openssl rand -hex 22` to generate a random salt.
```sh
SLACK_OAUTH_STATE_SALT=your-slack-oauth-state-salt # change this
```
3. **Shutdown**. Run the following command to shutdown all services.
```sh
sudo docker compose -f compose.yml -f compose.prod.yml --profile migrate down
```
4. **Startup**. Finally, run the `install.sh` script for the configuration to take effect.
```sh
sudo ./install.sh
```
[Go back to self host guide](https://measure.sh/docs)
---
Source: https://measure.sh/docs/hosting/migration-guides
---
# Migration Guides
Use these guides when upgrading to newer versions of Measure that requires some additional configurations, like one time data maintenance operations. For the usual upgrade process, [follow this guide](https://measure.sh/docs/../../hosting).
Some migrations may contain _optional_ steps. The specific guide would state that clearly.
## List of Migration Guides
- Choose as per your target version.
- These are bridge versions, so if you are upgrading from an ancient version, make sure to run the migration guide for each version in order.
- [**v0.4.x**](https://measure.sh/docs/v0.4.x) - Migration Guide for `v0.4.x`
- [**v0.6.x**](https://measure.sh/docs/v0.6.x) - Migration Guide for `v0.6.x`
- [**v0.8.x**](https://measure.sh/docs/v0.8.x) - Migration Guide for `v0.8.x`
- [**v0.9.x**](https://measure.sh/docs/v0.9.x) - Migration Guide for `v0.9.x`
- [**v0.10.x**](https://measure.sh/docs/v0.10.x) - Migration Guide for `v0.10.x`
---
Source: https://measure.sh/docs/hosting/migration-guides/v0.4.x
---
# Migration Guide for `v0.4.x`
Use this guide only when you are on less than `v0.4.0` and upgrading to `v0.4.x`.
> [!WARNING]
>
> Steps mentioned in this document will cause downtime.
## Upgrade while optionally dropping old data
Follow these steps to drop all older sessions **before upgrading**.
Follow these steps when upgrading to `0.4.x`. There is some downtime involved. During the downtime SDKs would receive a `503 Service Unavailable` when sending sessions. Once the upgrade is complete, ingestion should resume normally. SDKs will retry sending unsent sessions automatically.
### 1. SSH into the VM where Measure is hosted
### 2. Bring down services
> [!CAUTION]
> Skip to step 4 if you **do not want to delete old data**
```sh
cd measure/self-host
sudo docker compose down api cleanup
```
### 3. Run the following commands to drop all older sessions data
> [!CAUTION]
> Skip to step 4 if you **do not want to delete old data**
```sh
sudo docker compose exec clickhouse clickhouse-client --progress -q "truncate table events;"
sudo docker compose exec postgres psql -U postgres -c "truncate table unhandled_exception_groups, anr_groups, event_reqs;"
```
### 4. Perform the upgrade
Visit [Releases](https://github.com/measure-sh/measure/releases) page to capture the latest tag matching the `[MAJOR].[MINOR].[PATCH]` format.
```sh
cd ~/measure
git fetch --tags
git checkout
cd self-host
sudo docker compose -f compose.yml -f compose.prod.yml \
--profile init \
--profile migrate \
down
sudo docker compose pull
sudo ./install.sh
```
### 5. Run data backfills
Perform this step regardless of whether you chose to drop data or not. Certain features on the Measure dashboard like filters, metrics and some graphical plots won't show otherwise.
This may take some time. Make sure your SSH connection remains active until it completes.
```sh
sudo ./migrations/v0.4.x-data-backfills.sh
```
---
Source: https://measure.sh/docs/hosting/migration-guides/v0.6.x
---
# Migration Guide for `v0.6.x`
Use this guide only when you are on less than `v0.6.0` and upgrading to `v0.6.x`.
> [!WARNING]
>
> Steps mentioned in this document will cause downtime.
Follow these steps when upgrading to `0.6.x`. There is some downtime involved. During the downtime SDKs would receive a `503 Service Unavailable` when sending sessions. Once the upgrade is complete, ingestion should resume normally. SDKs will retry sending unsent sessions automatically.
## 1. SSH into the VM where Measure is hosted
## 2. Perform the upgrade
Visit [Releases](https://github.com/measure-sh/measure/releases) page to capture the latest tag matching the `[MAJOR].[MINOR].[PATCH]` format.
```sh
cd ~/measure
git reset --hard # only applies if you have local modifications
git fetch --tags
git checkout
cd self-host
sudo ./install.sh
```
## 3. Run data backfills
Perform this step to complete the migration. Certain features on the Measure dashboard like user defined attributes won't work otherwise.
This may take some time. Make sure your SSH connection remains active until it completes.
```sh
sudo ./migrations/v0.6.x-data-backfills.sh
```
---
Source: https://measure.sh/docs/hosting/migration-guides/v0.8.x
---
# Migration Guide for `v0.8.x`
Use this guide only when you are on less than `v0.8.0` and upgrading to `v0.8.x`.
> [!WARNING]
>
> Steps mentioned in this document will cause downtime.
Follow these steps when upgrading to `0.8.x`. There is some downtime involved. During the downtime SDKs would receive a `503 Service Unavailable` when sending sessions. Once the upgrade is complete, ingestion should resume normally. SDKs will retry sending unsent sessions automatically.
## 1. SSH into the VM where Measure is hosted
## 2. Perform the upgrade
Visit [Releases](https://github.com/measure-sh/measure/releases) page to capture the latest tag matching the `[MAJOR].[MINOR].[PATCH]` format.
```sh
cd ~/measure
git reset --hard # only applies if you have local modifications
git fetch --tags
git checkout
cd self-host
sudo ./install.sh
```
## 3. Run data backfills
Perform this step to complete the migration. Certain features on the Measure dashboard like crashes and ANRs won't work otherwise.
This may take some time. Make sure your SSH connection remains active until it completes.
```sh
sudo ./migrations/v0.8.x-backfills.sh
```
---
Source: https://measure.sh/docs/hosting/migration-guides/v0.9.x
---
# Migration Guide for `v0.9.x`
Use this guide only when you are on less than `v0.9.0` and upgrading to `v0.9.x`.
> [!WARNING]
>
> Steps mentioned in this document will cause downtime.
Follow these steps when upgrading to `0.9.x`. There is some downtime involved. During the downtime SDKs would receive a `503 Service Unavailable` when sending sessions. Once the upgrade is complete, ingestion should resume normally. SDKs will retry sending unsent sessions automatically.
## 1. SSH into the VM where Measure is hosted
## 2. Shutdown all Measure services
```sh
cd ~/measure/self-host
```
```sh
sudo docker compose -f compose.yml -f compose.prod.yml --profile init --profile migrate down --remove-orphans
```
## 3. Perform the upgrade
Visit [Releases](https://github.com/measure-sh/measure/releases) page to capture the latest tag matching the `[MAJOR].[MINOR].[PATCH]` format.
```sh
cd ~/measure
```
```sh
git reset --hard # only applies if you have local modifications
```
```sh
git fetch --tags
```
```sh
git checkout
```
## 4. Migrate configurations
```sh
cd self-host
```
```sh
sudo ./config.sh --production --ensure
```
## 5. Run database synchronization & migration scripts
Perform this step to complete the migration. Measure dashboard may not work properly until this step is completed.
```sh
sudo ./migrations/v0.9.x-sync-databases.sh
```
## 6. Start Measure services
```sh
sudo ./install.sh
```
---
Source: https://measure.sh/docs/hosting/migration-guides/v0.10.x
---
# Migration Guide for `v0.10.x`
Use this guide only when you are on less than `v0.10.0` and upgrading to `v0.10.x`.
> [!WARNING]
>
> Steps mentioned in this document will cause downtime.
Follow these steps when upgrading to `0.10.x`. There is some downtime involved. During the downtime SDKs would receive a `503 Service Unavailable` when sending sessions. Once the upgrade is complete, ingestion should resume normally. SDKs will retry sending unsent sessions automatically.
## 1. Shutdown all Measure services
SSH into the VM where Measure is hosted.
```sh
cd ~/measure/self-host
```
```sh
sudo docker compose -f compose.yml -f compose.prod.yml --profile init --profile migrate down --remove-orphans
```
## 2. Perform the upgrade
Visit [Releases](https://github.com/measure-sh/measure/releases) page to capture the latest tag matching the `v[MAJOR].[MINOR].[PATCH]` format. For example, `v0.10.0`.
```sh
cd ~/measure
```
```sh
git reset --hard # only applies if you have local modifications
```
```sh
git fetch --tags
```
```sh
# replace with the chosen tag. example: v0.10.0
git checkout
```
## 3. Create Google OAuth client secret
> [!NOTE]
>
> Skip this step if you only use **GitHub** sign in.
Starting with `v0.10.x`, Google sign-in uses a server-side code flow that requires the `OAUTH_GOOGLE_SECRET` environment variable. Previously, only the client ID (`OAUTH_GOOGLE_KEY`) was needed.
1. Go to [Google Cloud Console](https://console.cloud.google.com) > APIs & Services > Credentials
2. Click on your existing OAuth 2.0 Client ID, create a new **Client Secret** and copy it. (If you want to disable the existing client secret for security reasons and are sure it is not being used anywhere else outside of Measure, you can do so.)
3. Edit `self-host/.env` and add:
```sh
OAUTH_GOOGLE_SECRET=your-google-client-secret # change this
```
## 4. Set up an ingest endopint
Set up a new DNS A record for the new ingest endpoint like: `https://measure-ingest.yourcompany.com` pointing to your VM's IP. This step is new and recommended to ensure the best possible ingestion performance. Make sure to also update this endpoint as the `API_URL` in your apps. All the app versions prior to this change will continue to ingest as well.
## 5. Migrate configurations
```sh
cd ~/measure/self-host
```
```sh
sudo ./config.sh --production --ensure
```
You'll be prompted to enter the ingest endpoint you created in step 4 above. Should look like below:
 ## 6. Start Measure services
```sh
sudo ./install.sh
```
## 7. Run data back filling script
Perform this step to complete the migration. Measure dashboard will not work properly until these scripts are run.
```sh
sudo ./migrations/v0.10.x-data-backfills-1.sh
```
```sh
sudo ./migrations/v0.10.x-data-backfills-2.sh
```
```sh
sudo ./migrations/v0.10.x-read-optim.sh
```
---
Source: https://measure.sh
---
# Mobile apps break, get to the root cause faster.
Measure helps mobile teams monitor and fix crashes, ANRs, bugs, and performance issues. The open source alternative to **Firebase Crashlytics**.
## Trusted by high growth mobile teams
Kuku FM, Hoichoi, Country Delight, Dashreels, Turtlemint, Astro, Allofresh, SMC India, Even, Karya.
## One dashboard, Complete context
## Collect what you need, Only when you need it
Most monitoring data rots away in a warehouse and runs up your costs 💰. Our [Adaptive Capture](/product/adaptive-capture) feature lets you control and dynamically change what data to collect without needing to roll out app updates.
## Intelligent debugging, Seamless integration
Connect Measure with your favorite coding agents through our [MCP](/product/mcp) server. Let your coding agent query errors, traces and session timelines directly in your development workflow.
## Tried it, Loved it ❤️
> I've been using measure.sh lately to monitor my mobile apps and host it myself and it has been a delight. Definitely recommend it to anyone looking for an open source mobile app monitoring tool.
>
> — Hussain Mustafa ([source](https://x.com/husslingaround/status/1855983892294983980))
> I'm surprised this hasn't gained more attention yet — it's incredibly exciting for the mobile space, where we definitely lack observability and measure addresses so many of those gaps.
>
> — Aditya Pahilwani ([source](https://x.com/AdityaPahilwani/status/1843561672188821520))
> When I stumbled upon measure.sh, I was blown away! Crash-free sessions improved dramatically — now hitting a mythical 99.99% consistently. Logs, metrics, traces — finally stitched together in one view. Our hot & warm app startup times? Looking great!
>
> — Sutirth Chakravarty ([source](https://www.linkedin.com/posts/sutirthchakravarty_circa-early-2024-i-had-the-chance-to-attend-activity-7317570327520124928-yo1s))
> The good folks at measure.sh have been working on a mobile app monitoring platform for several months now and have open-sourced it. Do check it out and show it some love! This is quite a strong team that led several mobile platform initiatives at Gojek.
>
> — Ragunath Jawahar ([source](https://x.com/ragunathjawahar/status/1825490936857522290))
> I'm personally a fan. Not just of the product, but of the minds behind it. It's built by some of the sharpest mobile engineers I've admired for years. Folks who live and breathe performance, scaling, and observability. This isn't just another tool. It's crafted with intent, care, and deep expertise.
>
> — Iniyan Murugavel ([source](https://www.linkedin.com/posts/iniyanarul_crashes-were-observed-first-on-measure-activity-7316853914589413377-gFd_/))
> Looking for a way to keep tabs on your mobile apps? How about using a free and open-source solution? Consider exploring measure.sh!
>
> — Tuist ([source](https://www.linkedin.com/posts/tuistio_github-measure-shmeasure-measure-is-an-activity-7312413362292719616-DUlU))
## Built For Mobile Devs
For us, Mobile is not an add-on to an observability product. It **is** the product. Measure is built by mobile engineers, for mobile engineers.
- **Open Source** — [Star us on GitHub](https://github.com/measure-sh/measure).
- **Simple Pricing** — Pay only for the [data you use](/pricing). No seat limits or feature restrictions.
- **Every mobile platform** — Android, iOS, Flutter, React Native (soon).
Get started:
---
Source: https://measure.sh/about
---
# For mobile engineers, by mobile engineers
We built Measure to solve the unique challenges mobile developers face in monitoring production apps.
After spending years in the trenches building mobile apps at scale, we understood that existing tools that are often web and backend centric don't address mobile-specific needs.
For us, mobile is not an add-on to an observability product. Mobile **is** the product.
We strongly believe that tools for mobile developers can and should be better and that's what drives us everyday.
## Team
- **[Gandharva Kumar](https://www.linkedin.com/in/gandharvakr/)** — CEO
- **[Anup Cowkur](https://www.linkedin.com/in/anupcowkur/)** — CTO
- **[Abhay Sood](https://www.linkedin.com/in/abhaysood/)** — Head of Mobile
- **[Debjeet Biswas](https://www.linkedin.com/in/debjeet-biswas-9b4337281/)** — Head of Infra
- **[Adwin Ross](https://www.linkedin.com/in/adwin-ronald-ross/)** — Mobile Engineer
## Investors
Picus Capital · DeVC · Astir Ventures
## Angels
- Mustafa Ali — Head of Mobile, Shopify
- Kunal Shah — Founder, CRED
- Misbah Ashraf — Co-Founder, Jar
- Vatsal Singhal — Co-Founder, Ultrahuman
- Anshuman Bajoria — Strategy and Operations, Revolut
- Anuj Bhagat — Product, Google
- Sudhanshu Raheja — President, GoTo Financial
- Sidu Ponnappa — CEO, realfast
- Abhinit Tiwari — Head of Design, Gojek
- Ranjan Sakalley — Co-Founder, base14
- Gaurav Batra — Co-Founder, Semaai
- Paul Meinshausen — CEO, Aampe
Get started:
---
Source: https://measure.sh/bugsnag-alternative
---
# Looking for Bugsnag alternatives?
Bugsnag is an established error monitoring and app stability tool covering mobile alongside web and backend across dozens of platforms.
Measure is a mobile first, open source Bugsnag alternative.
## Full session context on every issue
Bugsnag gives you stack traces with breadcrumb trails of what happened before the error. Breadcrumbs have a max limit and there is no visual replay of the session.
Measure attaches a full [Session Timeline](/product/session-timelines) with gestures, navigation, network calls, lifecycle events and custom spans to every crash, ANR and error, with no hard limit on what you can see.
You see exactly what the user did and what the app did, on every issue, without any compromise on the context.
## Adaptive capture, not quota sampling
Bugsnag keeps you limited to the tier you pay for by sampling. Performance data is sampled server-side so it fits your span quota, and errors are metered against a monthly event quota. In case of traffic spikes or sudden user growth, you would end up with less visibility into your system when you need more.
Measure captures full session context by default, and with [Adaptive Capture](/product/adaptive-capture) you can tune what you collect remotely, without shipping an app update.
Dial up on new releases or when chasing tricky production issues, dial down whenever you need to.
## Fully open source
Bugsnag publishes its notifier SDKs on GitHub under the MIT license, but the backend and dashboard are proprietary. You can read the SDK but the rest of the platform is opaque.
Measure is [fully open source](https://github.com/measure-sh/measure). Read it, run it, self-host it, audit the pipeline and if you think something can be done better, send a pull request.
## Simple, predictable pricing
Bugsnag meters two separate things, error events and performance spans, each against its own monthly quota. Exceeding quotas means sampling or overage.
Measure has a single, transparent [price](/pricing) based on how much data you use. No separate product meters. With [Adaptive Capture](/product/adaptive-capture) you can dial collection up or down without rolling out app updates to control your costs even better.
## Built for mobile, by mobile devs
Bugsnag monitors mobile, web and backend across 50+ platforms and is now one product inside SmartBear's larger testing and monitoring suite. Mobile is one player among many, and the defaults, platform decisions, dashboards and roadmap are shaped by the whole portfolio rather than by the needs of mobile devs alone.
Measure is built only for mobile. [Crashes & ANRs](/product/crashes-and-anrs), [App Health](/product/app-health), [Performance Traces](/product/performance-traces), [Network Performance](/product/network-performance), [Bug Reports](/product/bug-reports) and [User Journeys](/product/user-journeys) are all designed around how mobile apps actually break in production.
Mobile is not a part of our product, it is the whole product.
## Measure vs Bugsnag
| Capability | Measure | Bugsnag |
| --- | --- | --- |
| Crash reporting with full session timelines | ✓ | Crash reports with limited breadcrumbs |
| ANR detection with full session timelines | ✓ | ANRs with limited breadcrumbs |
| Performance traces | ✓ | ✓ |
| Network monitoring | ✓ | ✓ |
| User journeys | ✓ | ✗ |
| In-app bug reports | ✓ | ✗ |
| Session timeline on every issue | ✓ | Limited breadcrumbs only |
| Dynamic Sampling with Adaptive Capture | ✓ | Quota-driven sampling |
| Auto-captured context | Gestures, navigation, network, lifecycle | Navigation, network, taps via limited breadcrumbs |
| Pricing | Simple pricing based on data usage | Separate quotas for error events & performance spans |
| Open Source | Apache 2.0 (OSI open source) | SDKs only |
| Self-hostable | ✓ | Enterprise on-premise |
| Public roadmap & issue tracker | ✓ | SDK repos only |
| Mobile focus | ✓ | One of many platforms |
Get started:
---
Source: https://measure.sh/crashlytics-alternative
---
# Looking for Firebase Crashlytics alternatives?
Firebase Crashlytics is a free and popular crash reporting tool that many apps start with.
Measure is a mobile first, open source Firebase Crashlytics alternative.
## Beyond Crashes
Crashlytics handles basic crash reporting but requires more tooling to complete the mobile app monitoring picture.
Performance traces need the performance monitoring add-on. Understanding what the user was doing when the crash happened requires enabling Google Analytics and manually instrumenting breadcrumb logs. Bug reporting requires third party tooling. Data analysis needs BigQuery export which is charged separately. The number of SDKs in your app and the tools you need to look at keep expanding.
Measure unifies [Crashes & ANRs](/product/crashes-and-anrs), [Network Performance](/product/network-performance), [Performance Traces](/product/performance-traces), [App Health](/product/app-health), [Bug Reports](/product/bug-reports) and [User Journeys](/product/user-journeys) in one product. Every issue comes with a full Session Timeline which is auto collected for you without having to manually instrument every user interaction in your app.
One SDK, one dashboard, one place to look so you can stop stitching context and get to the root cause faster.
## Full session context, not just stack traces
Crash reports in Crashlytics come with stack traces and manually instrumented breadcrumbs. Taps, navigations, network calls or lifecycle events require manual instrumentation which needs to be updated and synced when your app code changes in new releases.
Measure auto-captures gestures, navigation, lifecycle events, network calls and custom spans, and replays them as a [Session Timeline](/product/session-timelines) attached to every crash, ANR or error.
Measure makes it easy to see what the user did, what the app did and where things went wrong, without instrumenting every screen by hand.
## Open source
The Crashlytics SDKs are open source on GitHub, but the backend and dashboard are closed and run only on Google's proprietary infrastructure.
Measure is [fully open source](https://github.com/measure-sh/measure). Read it, run it, self-host it, audit the pipeline and if you think something can be done better, send a pull request.
## Simple, transparent pricing
Crashlytics itself is free. The catch is that going further usually means stepping into the rest of the Firebase and GCP pricing ecosystem. BigQuery exports for data analysis, Cloud Functions for alerting and other paid GCP services require separate payment for advanced operations on your data.
Measure has a single, transparent [price](/pricing) based on how much data you use. No per-seat charges, no hidden product bundles. With [Adaptive Capture](/product/adaptive-capture) you can dial collection up or down without rolling out app updates to control costs further.
## Built for mobile, by mobile devs
Crashlytics sits inside the larger Firebase suite where mobile is one product line among many. The product roadmap and platform decisions compete with the priorities of a much bigger platform.
Measure is built only for mobile. [Crashes & ANRs](/product/crashes-and-anrs), [App Health](/product/app-health), [Performance Traces](/product/performance-traces), [Network Performance](/product/network-performance), [Bug Reports](/product/bug-reports) and [User Journeys](/product/user-journeys) are all designed around how mobile apps actually break in production.
Mobile is not a part of our product, it is the whole product.
## Measure vs Firebase Crashlytics
| Capability | Measure | Firebase Crashlytics |
| --- | --- | --- |
| Crash reporting with full session timelines | ✓ | Crash reports with manual breadcrumbs |
| ANR detection with full session timelines | ✓ | ANRs with manual breadcrumbs |
| Performance traces without sampling | ✓ | Sampled |
| Network monitoring without sampling | ✓ | Sampled |
| User journeys | ✓ | Needs Google Analytics |
| In-app bug reports | ✓ | ✗ |
| Session timeline on every issue | ✓ | ✗ |
| Dynamic Sampling with Adaptive Capture | ✓ | ✗ |
| Auto-captured context | Gestures, navigation, network, lifecycle | Screen views if Google Analytics is enabled but rest needs manual instrumentation |
| Pricing | Simple pricing based on data usage | Free crash reporting but complex Google Analytics + BigQuery pricing for advanced users |
| Open Source | Apache 2.0 (OSI open source) | SDKs only |
| Self-hostable | ✓ | ✗ |
| Public roadmap & issue tracker | ✓ | SDK repos only |
| Raw data access | Data export whenever you need it | Paid export to BigQuery only |
| Mobile focus | ✓ | One of many Firebase products |
Get started:
---
Source: https://measure.sh/datadog-alternative
---
# Looking for Datadog alternatives?
Datadog is a comprehensive observability platform with roots in infrastructure and backend monitoring, spanning servers, cloud, APM, logs, security, web and mobile.
Measure is a mobile first, open source Datadog alternative.
## Full session context on every issue
Datadog gives you stack traces and auto-captured events out of the box with Mobile Session Replays billed separately. If you want full context on every error, you will need to turn on Mobile Session Replays for all of them and accommodate the significant cost increase.
Measure attaches a full [Session Timeline](/product/session-timelines) with gestures, navigation, network calls, lifecycle events and custom spans to every crash, ANR and error and you only pay for the data used as a whole.
You see exactly what the user did and what the app did, on every issue, without any compromise on the context.
## Adaptive capture, not fixed sampling
Datadog uses client-side sampling. You set a session sample rate, with a separate replay sample rate applied on top and decide up front what fraction to keep.
Measure captures full session context by default, and with [Adaptive Capture](/product/adaptive-capture) you can tune what you collect remotely, without shipping an app update.
Dial up sample rates on new releases or when chasing tricky production issues, dial down whenever you need to.
## Fully open source
Datadog publishes its mobile SDKs as open source, but the backend and dashboard are proprietary. You can read the SDK, but you can't see or run the platform that ingests and stores your data.
Measure is [fully open source](https://github.com/measure-sh/measure). Read it, run it, self-host it, audit the pipeline and if you think something can be done better, send a pull request.
## Simple, predictable pricing
Datadog is metered across a long list of separate SKUs. RUM sessions are split into tiers, Mobile Session Replay is billed on top, and per-host APM, infrastructure and logs have their own price lists.
Measure has a single, transparent [price](/pricing) based on how much data you use. No per-seat fees, no separate product meters. With [Adaptive Capture](/product/adaptive-capture) you can dial collection up or down without rolling out app updates to control your costs even better.
## Built for mobile, by mobile devs
Datadog monitors infrastructure, servers, cloud, APM, logs, security and frontend across hundreds of integrations. Mobile is one small corner of a sprawling observability platform, and the defaults, dashboards, product decisions and roadmap are shaped by the whole platform rather than by the needs of mobile devs alone.
Measure is built only for mobile. [Crashes & ANRs](/product/crashes-and-anrs), [App Health](/product/app-health), [Performance Traces](/product/performance-traces), [Network Performance](/product/network-performance), [Bug Reports](/product/bug-reports) and [User Journeys](/product/user-journeys) are all designed around how mobile apps actually break in production.
Mobile is not a part of our product, it is the whole product.
## Measure vs Datadog
| Capability | Measure | Datadog |
| --- | --- | --- |
| Crash reporting with full session timelines | ✓ | Crash reports with auto-captured events, session replay sampled & billed separately |
| ANR detection with full session timelines | ✓ | ANRs, session replay sampled & billed separately |
| Performance traces | ✓ | ✓ |
| Network monitoring | ✓ | ✓ |
| User journeys | ✓ | ✓ |
| In-app bug reports | ✓ | ✗ |
| Session timeline on every issue | ✓ | Session replay, sampled & billed separately |
| Dynamic Sampling with Adaptive Capture | ✓ | Client side only sampling |
| Auto-captured context | Gestures, navigation, network, lifecycle | Actions, views, network, errors |
| Pricing | Simple pricing based on data usage | Separate SKUs for RUM session tiers, replay, APM, infra & logs |
| Open Source | Apache 2.0 (OSI open source) | SDKs only |
| Self-hostable | ✓ | ✗ |
| Public roadmap & issue tracker | ✓ | SDK repos only |
| Mobile focus | ✓ | One small part of a huge platform |
Get started:
---
Source: https://measure.sh/embrace-alternative
---
# Looking for Embrace alternatives?
Embrace is a mobile and web observability platform that offers crash reporting, ANR tracking, network monitoring and performance traces.
Measure is a mobile first, open source Embrace alternative.
## Full session context on every issue
Embrace and Measure both attach a full session view to every crash, ANR and error and capture it automatically.
Measure records gestures, navigation, network calls, lifecycle events and custom spans into a full [Session Timeline](/product/session-timelines) on every issue.
The key difference is transparency. Measure is open source, the platform that stores your user data is transparent, and you never have to send your data to a proprietary, locked platform.
## Adaptive capture, not all-or-nothing
Measure and Embrace both allow you to capture full session data without sampling. Where they differ is control: Embrace captures everything and bills per session, so full context means paying for every session your app generates which can be significant at scale.
Measure captures full session context, but with [Adaptive Capture](/product/adaptive-capture) you can tune what you collect remotely, without shipping an app update.
Dial up on a new release, dial down to cut cost or noise. You decide how much you collect, and change it whenever you need to.
## Fully open source
Embrace open sources its SDKs but the backend and dashboard that ingest, store and surface your data are locked behind a proprietary platform with no auditability.
Measure is [fully open source](https://github.com/measure-sh/measure). Run the entire stack yourself, audit the pipeline end to end, keep your data on your own infrastructure if you choose, and if something can be done better, send a pull request.
## Simple, predictable pricing
Embrace charges per session which means a session with barely any activity matters the same as one with lots of interactions.
Measure has a single, transparent [price](/pricing) based on how much data you actually ingest which is a much more practical metric as it relates directly to usage of the platform without meaningless sessions costing more than they need to. With [Adaptive Capture](/product/adaptive-capture) you can also tune collection anytime to keep costs in check.
## Built for mobile, by mobile devs
Embrace supports mobile and web monitoring. Mobile is one of the supported platforms, and the defaults, platform decisions, dashboards and product roadmap are shaped by the whole platform rather than by the needs of mobile devs alone.
Measure is mobile first and focused on mobile developers. [Crashes & ANRs](/product/crashes-and-anrs), [App Health](/product/app-health), [Performance Traces](/product/performance-traces), [Network Performance](/product/network-performance), [Bug Reports](/product/bug-reports) and [User Journeys](/product/user-journeys) are all shaped only by how mobile apps break in production.
Mobile is not a part of our product, it is the whole product.
## Measure vs Embrace
| Capability | Measure | Embrace |
| --- | --- | --- |
| Crash reporting with full session timelines | ✓ | ✓ |
| ANR detection with full session timelines | ✓ | ✓ |
| Performance traces | ✓ | ✓ |
| Network monitoring | ✓ | ✓ |
| User journeys | ✓ | ✓ |
| In-app bug reports | ✓ | ✗ |
| Session timeline on every issue | ✓ | ✓ |
| Dynamic Sampling with Adaptive Capture | ✓ | Always-on full capture |
| Auto-captured context | Gestures, navigation, network, lifecycle | Taps, views, network, lifecycle |
| Pricing | Simple pricing based on data usage | Per session |
| Open Source | Apache 2.0 (OSI open source) | SDKs only |
| Self-hostable | ✓ | ✗ |
| Public roadmap & issue tracker | ✓ | SDK repos only |
| Mobile focus | ✓ | Mobile and Web |
Get started:
---
Source: https://measure.sh/for/android
---
# Measure for Android
Measure is an open source, mobile first monitoring platform built for Android. Measure gives you all the context you need to decrease crash rates, increase app performance and deliver smoother experiences for your Android app users.
## Session Timelines
Every crash and ANR in your Android app arrives with a full [Session Timeline](/product/session-timelines). Replay the exact sequence of events that led to the issue — gestures, navigation, network calls, logs and lifecycle events — with CPU and memory signals right alongside.
Stop guessing from a stack trace and see exactly what the user and the app did leading up to the moment things went wrong.
## Detailed Stack Traces
Every [crash and ANR](/product/crashes-and-anrs) comes with a full stack trace captured across every thread, so you can figure out what each thread was doing, not just the one that threw the error.
Stack traces are automatically deobfuscated, mapping minified R8 and ProGuard output back to your original class and method names with their intact line numbers. Mapping files are automatically uploaded by our Gradle plugin so you can focus on fixing issues and let Measure handle the boring stuff.
## Performance Monitoring
Instrument the operations that matter most with [Performance Traces](/product/performance-traces). See how API fetches, database calls, expensive code paths and screen rendering stack up within a single user flow or across millions of sessions with waterfall charts that make bottlenecks obvious.
Traces carry rich device and app context linking back to full session timelines, so you can tie slow operations to the environment they happened in.
## App Health
Stay on top of every release with [App Health](/product/app-health). Track app adoption, crash-free and ANR-free sessions, error rates as your users actually perceive them, app size, and launch times across cold, warm and hot starts.
Spot a bad rollout early and fix it before it reaches the rest of your users.
## Bug Reports
Let users report problems the moment they see them with [Bug Reports](/product/bug-reports), triggered by a device shake or a call to the SDK from your own button. Each report captures device information, app version, network conditions and screenshots alongside the user's description, and links straight to the complete session timeline.
Skip the email threads and support ticket back-and-forth. Your users describe the issue in their own words and you get all the context you need to solve it.
## User Journeys
See the real paths users take through your app with [User Journeys](/product/user-journeys). Every screen transition is mapped automatically into clear flow diagrams, and the exception view shows exactly where issues interrupt those flows.
Short on time and figuring out what issues to prioritize? Easily see which paths are important to users so you can unblock them first.
## Network Monitoring
Watch every request your app makes with [Network Performance](/product/network-performance). See HTTP status code distributions over time and drill into your top endpoints ranked by latency, error rate and request frequency to find the calls slowing your app down.
Catch degraded endpoints early and optimize the API calls that matter most to your users.
## Coding Agents
Bring all of Measure's context into your favorite coding agents. The [Measure MCP server](/product/mcp) gives any coding agent access to your crashes, ANRs, performance traces and session timelines, straight from your IDE, editor or terminal.
Ask it to help you debug a crash, analyze user sessions or use it to set up an agentic issue triage and debug pipeline. Whether you're team Claude Code or Codex, or prefer open source agents and models, Measure fits right into your workflows.
Works with Claude Code, Cursor, Codex, Gemini CLI, Windsurf, Cline, opencode and Kilo Code.
Get started:
---
Source: https://measure.sh/for/flutter
---
# Measure for Flutter
Measure is an open source, mobile first monitoring platform built for Flutter. It brings together the full context behind every crash and error across your Dart and native code, so you can drive down crash and error rates, smooth out performance issues and deliver a delightful experience on both Android and iOS.
## Session Timelines
Every crash and error in your Flutter app comes with a complete [Session Timeline](/product/session-timelines) you can replay. Step back through the exact lead-up — gestures, navigation, network calls, logs and lifecycle events — with CPU and memory readings plotted right beside them.
Instead of reading an out-of-context Dart stack trace, you can see exactly what the user did and how the app responded just before things went wrong.
## Detailed Stack Traces
Every [crash and error](/product/crashes-and-anrs) carries a complete Dart stack trace, alongside any native crash from the Android or iOS side.
Stack traces are automatically deobfuscated, mapping both native and Dart code to your original class and method names with their intact line numbers. Let Measure deal with the tedious part so you can focus on debugging issues.
## Performance Monitoring
Wrap the operations that matter in [Performance Traces](/product/performance-traces). See how network requests, platform channels, expensive widget builds and rendering stack up within a single flow or across millions of sessions with waterfall charts that make the slow parts obvious.
Every trace comes with full device and app context and ties back to its session timeline, so a slow span never shows up without the conditions that produced it.
## App Health
Keep a close eye on every release with [App Health](/product/app-health). Follow adoption, crash-free sessions, user perceived error rates, app size, and launch times across your Android and iOS builds.
Notice a buggy rollout early and fix it before it spreads to the rest of your users.
## Bug Reports
Let users report a problem the second they notice it with [Bug Reports](/product/bug-reports), triggered by a device shake or from your own button through the SDK. Each report packages device details, app version, network conditions and a screenshot next to the user's description, and makes it easy to jump straight to the matching session timeline.
Forget the email threads and support ticket back-and-forth — your users explain the issue in their own words and you get every bit of context needed to resolve it.
## User Journeys
Follow the paths people take through your production app with [User Journeys](/product/user-journeys). Every screen transition is charted automatically into clear flow diagrams, and the exception view marks exactly where issues derail those flows.
Deciding what to fix first? See which routes carry the most users so you can clear the most frequent blockers.
## Network Monitoring
See every request your app makes with [Network Performance](/product/network-performance). Follow how HTTP status codes shift over time and drill into your heaviest endpoints, ranked by latency, error rate and call volume, to find the requests slowing down your app.
Catch failing endpoints early and tune the API calls your users depend on most.
## Coding Agents
Bring Measure's full context into the coding agents you already work with. The [Measure MCP server](/product/mcp) hands any agent your crashes, errors, performance traces and session timelines, directly from your IDE, editor or terminal.
Point it at a crash, work through user sessions, or build it into an agentic triage and debugging pipeline. Whether you're on Claude Code or Codex, or you prefer open source agents and models, Measure drops straight into your workflow.
Works with Claude Code, Cursor, Codex, Gemini CLI, Windsurf, Cline, opencode and Kilo Code.
Get started:
---
Source: https://measure.sh/for/ios
---
# Measure for iOS
Measure is an open source, mobile first monitoring platform built for iOS. Measure gives you the full context behind every crash and slowdown, so you can decrease crashes and errors, improve performance and deliver a smoother experience to your iOS app users.
## Session Timelines
Every crash and error in your iOS app gets a complete [Session Timeline](/product/session-timelines) attached. Step back through everything that led up to it — taps and gestures, screen navigation, network calls, logs and lifecycle events — with CPU and memory readings plotted right beside them.
Instead of working backwards from a lone stack trace, you can see exactly what the user did and how the app responded in the moments before things broke.
## Detailed Stack Traces
Every [crash report](/product/crashes-and-anrs) comes with a full stack trace captured across every thread, so you can see what each one was doing, not just the thread that crashed.
Traces are symbolicated automatically, turning raw memory addresses back into the original function names, files and line numbers from your Swift and Objective-C sources. Upload your dSYMs through the Xcode build phase or straight from your .xcarchive and let Measure handle the symbolication so you can stay focused on the fix.
## Performance Monitoring
Put traces around the operations you care about with [Performance Traces](/product/performance-traces). Watch how network requests, disk and database work, heavy code paths and screen rendering add up inside a single user flow or across millions of sessions with waterfall charts that make the slow parts jump out.
Each trace carries detailed device and app context and links back to the full session timeline, so a slow operation always comes with the conditions it ran under.
## App Health
Keep a close eye on every release with [App Health](/product/app-health). Follow adoption, crash-free sessions, the error rates your users actually perceive, app size, and launch times across cold, warm and hot starts.
Catch a bad rollout while it's still contained and fix it before it reaches the rest of your users.
## Bug Reports
Let users flag problems the instant they hit them with [Bug Reports](/product/bug-reports), triggered by a device shake or from your own button through the SDK. Every report bundles device details, app version, network conditions and a screenshot together with the user's note, and links straight to the matching session timeline.
No more long email threads or support ticket ping-pong. Users describe the issue in their own words while you get all the context needed to fix it.
## User Journeys
Trace the actual routes people take through your app with [User Journeys](/product/user-journeys). Screen-to-screen movement is mapped for you into clear flow diagrams, and the exception view shows you where issues degrade those flows.
Not sure what to tackle first? See at a glance which paths matter most to your users so you can prioritize effectively.
## Network Monitoring
Keep tabs on every request your app fires with [Network Performance](/product/network-performance). Track how HTTP status codes trend over time and dig into your busiest endpoints, ranked by latency, error rate and call volume, to surface the requests dragging your app down.
Spot failing endpoints early and tune the API calls that matter most to your users.
## Coding Agents
Pull all of Measure's context into the coding agents you already use. The [Measure MCP server](/product/mcp) opens up your crashes, performance traces and session timelines to any agent, right from your IDE, editor or terminal.
Have it dig into a crash, walk through user sessions, or wire it into an agentic triage and debugging pipeline. Whether you lean on Claude Code or Codex, or prefer open source agents and models, Measure slots straight into your workflow.
Works with Claude Code, Cursor, Codex, Gemini CLI, Windsurf, Cline, opencode and Kilo Code.
Get started:
---
Source: https://measure.sh/for/ipados
---
# Measure for iPadOS
Measure is an open source, mobile first monitoring platform with full support for iPadOS. It surfaces the complete context behind every crash and performance issue to help you cut crash and error rates, sharpen performance and keep your iPad app feeling effortless.
## Session Timelines
Every crash and error on iPad comes with a complete [Session Timeline](/product/session-timelines) you can replay. Walk back through the exact run-up to the failure — gestures, screen navigation, network calls, logs and lifecycle events — with CPU and memory readings plotted right alongside.
A stack trace only tells you where things broke. The timeline shows how your app got there and what the user was doing in the moments before failure.
## Detailed Stack Traces
Every [crash report](/product/crashes-and-anrs) carries a complete, multi-threaded stack trace, so you can inspect what each thread was up to, not just the one that failed.
Measure symbolicates them for you, mapping raw memory addresses back to the original function names, files and line numbers in your Swift and Objective-C code. Upload your dSYMs through the Xcode build phase or straight from your .xcarchive and let Measure worry about the symbolication so you can stay focused on the fix.
## Performance Monitoring
Wrap the operations that matter in [Performance Traces](/product/performance-traces). See how network requests, disk and database access, expensive code paths and the rendering of those larger iPad layouts accumulate within a single flow or across millions of sessions with waterfall views that make the slow parts obvious.
Every trace comes with full device and app context and ties back to its session timeline, so a slow span never shows up without the conditions that produced it.
## App Health
Track the health of every release in one place with [App Health](/product/app-health). Monitor adoption, error rates, launch times and more core app metrics in one unified view.
Notice a shaky rollout early and patch it before it spreads to the rest of your users.
## Bug Reports
Let people report a problem the second they run into it with [Bug Reports](/product/bug-reports), triggered by a shake or from a button you wire up through the SDK. Each one packages device details, app version, network conditions and a screenshot next to the user's own description, and allows you to jump straight to the matching session timeline.
Forget the back-and-forth of email and support tickets. Your users explain the issue in their own words and you get every bit of context needed to resolve it.
## User Journeys
Follow the real paths people take through your app with [User Journeys](/product/user-journeys). Every screen transition is charted automatically into clear flow diagrams, and the exception view marks exactly where issues derail those flows.
Deciding what to fix first? See which routes carry the most users so you can unblock the busiest ones ahead of the rest.
## Network Monitoring
See every request your app makes with [Network Performance](/product/network-performance). Follow how HTTP status codes shift over time and drill into your heaviest endpoints ranked by latency, error rate and call volume to find the requests degrading your app performance.
Catch endpoints going bad early and take care of the API calls your users depend on most.
## Coding Agents
Bring Measure's full context into the coding agents you already work with. The [Measure MCP server](/product/mcp) hands any agent your crashes, performance traces and session timelines, directly from your IDE, editor or terminal.
Point it at a crash, have it work through user sessions, or build it into an agentic triage and debugging pipeline. Whether you're on Claude Code or Codex, or you prefer open source agents and models, Measure drops straight into your workflow.
Works with Claude Code, Cursor, Codex, Gemini CLI, Windsurf, Cline, opencode and Kilo Code.
Get started:
---
Source: https://measure.sh/for/react-native
---
# Measure for React Native
Measure is an open source, mobile first monitoring platform built for React Native. Whether you use vanilla React Native or Expo, Hermes or JavaScriptCore, Measure gives you the full context behind every error across your JavaScript and native layers, so you can cut crash rates, tighten performance and ship a smoother experience on both Android and iOS.
## Session Timelines
Every error in your React Native app arrives with a complete [Session Timeline](/product/session-timelines). Replay the exact path to the issue — gestures, navigation, network calls, logs and lifecycle events — with CPU and memory readings right alongside.
Rather than piecing together a minified stack trace, you see exactly what the user did and how the app behaved in the moments before it broke.
## Detailed Stack Traces
Every [crash and error](/product/crashes-and-anrs) comes with a complete stack trace. JavaScript errors are symbolicated from your sourcemaps, so you read your own functions, files and line numbers instead of minified output, and crashes from the native Android and iOS layers are captured and mapped too.
Sourcemaps and native mapping files are uploaded automatically, so you can let Measure take care of the boring stuff and focus on fixing user issues.
## Performance Monitoring
Put traces around the operations that matter with [Performance Traces](/product/performance-traces). See how network requests, native modules, expensive JavaScript and screen rendering stack up within a single user flow or across millions of sessions with waterfall charts that make bottlenecks obvious.
Each trace carries rich device and app context and links back to the full session timeline, so a slow operation always comes with the environment it ran in.
## App Health
Stay on top of every release with [App Health](/product/app-health). Track adoption, crash-free sessions, app size, and launch times for your Android and iOS builds alike.
Spot a bad rollout early and fix it before it reaches the rest of your users.
## Bug Reports
Let users flag problems the moment they hit them with [Bug Reports](/product/bug-reports), triggered by a device shake or a call to the SDK from your own button. Each report bundles device details, app version, network conditions and screenshots with the user's own words, with an easy link straight to the matching session timeline.
Skip the email threads and support ticket back-and-forth. Your users describe the issue and you get all the context you need to solve it.
## User Journeys
See the paths users take through your app with [User Journeys](/product/user-journeys). Every screen transition is mapped automatically into clear flow diagrams, and the exception view shows where issues interrupt those flows.
Short on time? See which paths matter most to your users so you can prioritize issues by user traffic.
## Network Monitoring
Watch every request your app makes with [Network Performance](/product/network-performance). Track HTTP status codes over time and drill into your top endpoints, ranked by latency, error rate and request volume, to find the calls slowing your app down.
Catch degraded endpoints early and tune the API calls that matter most to your users.
## Coding Agents
Bring all of Measure's context into the coding agents you already use. The [Measure MCP server](/product/mcp) gives any agent access to your crashes, errors, performance traces and session timelines, straight from your IDE, editor or terminal.
Have it dig into a crash, work through user sessions, or wire it into an agentic triage and debugging pipeline. Whether you lean on Claude Code or Codex, or prefer open source agents and models, Measure fits right into your workflow.
Works with Claude Code, Cursor, Codex, Gemini CLI, Windsurf, Cline, opencode and Kilo Code.
Get started:
---
Source: https://measure.sh/luciq-alternative
---
# Looking for Luciq alternatives?
Luciq (formerly Instabug) originally started with bug reporting but later expanded to become a full mobile observability platform.
Measure is a mobile first, open source Luciq alternative.
## Full session context on every issue
Measure and Luciq both record full session replays and attach logs, network calls, device details and repro steps to the issues you debug, giving you far more than a stack trace.
Measure captures gestures, navigation, network calls, lifecycle events and custom spans into a full [Session Timeline](/product/session-timelines) on every issue.
The key difference is transparency. With Measure, you can audit what happens to those collected sessions since our entire platform is open source. From the SDK to the backend processing and the storage layer, you can see what Measure does with your data and verify it yourself. No need for blind trust, just read the source.
## Adaptive capture, on your terms
Measure captures full session context by default, and with [Adaptive Capture](/product/adaptive-capture) you can tune what you collect remotely, without shipping an app update.
Luciq does not give you the same remote control to increase capture while you chase a tricky bug and then pull it back to keep cost and noise down.
Turn detail up on a new release, down afterwards, and change it whenever you need to.
## Fully open source
Luciq is proprietary. Its SDK is published on GitHub, but under a license that forbids modifying it (use as is, all rights reserved), and the backend and dashboard are a closed platform you can neither run nor inspect.
Measure is [fully open source](https://github.com/measure-sh/measure). Read it, run it, self-host it, audit the pipeline end to end, and if you think something can be done better, send a pull request.
## Simple, predictable pricing
Luciq charges per daily active user and per seat and requires a sales call to get a quote. App users without much activity end up adding to costs, and every team member who needs access to the dashboard increases costs further.
Measure has a single, transparent [price](/pricing) based on how much data you use. No per-seat fees, no per-user charges, no sales call needed. With [Adaptive Capture](/product/adaptive-capture) you can tune collection to keep costs in check.
## Built for mobile, by mobile devs
Luciq and Measure are both mobile first platforms. Luciq is closed source and proprietary.
Measure is open source and built in the open, with a public roadmap and issue tracker, made for mobile developers to read, participate and contribute. [Crashes & ANRs](/product/crashes-and-anrs), [App Health](/product/app-health), [Performance Traces](/product/performance-traces), [Network Performance](/product/network-performance), [Bug Reports](/product/bug-reports) and [User Journeys](/product/user-journeys) are all shaped by how mobile apps break in production.
Measure is built with the community, incorporating continuous feedback which we strongly believe leads to a better platform for mobile developers.
## Measure vs Luciq
| Capability | Measure | Luciq |
| --- | --- | --- |
| Crash reporting with full session timelines | ✓ | ✓ |
| ANR detection with full session timelines | ✓ | ✓ |
| Performance traces | ✓ | ✓ |
| Network monitoring | ✓ | ✓ |
| User journeys | ✓ | ✓ |
| In-app bug reports | ✓ | ✓ |
| Session timeline on every issue | ✓ | ✓ |
| Dynamic Sampling with Adaptive Capture | ✓ | ✗ |
| Auto-captured context | Gestures, navigation, network, lifecycle | Screen changes, interactions, network, logs |
| Pricing | Simple pricing based on data usage | Per active user + seat, sales call needed |
| Open Source | Apache 2.0 (OSI open source) | Proprietary |
| Self-hostable | ✓ | ✗ |
| Public roadmap & issue tracker | ✓ | ✗ |
| Mobile focus | ✓ | ✓ |
Get started:
---
Source: https://measure.sh/new-relic-alternative
---
# Looking for New Relic alternatives?
New Relic is a comprehensive, all-in-one observability platform spanning APM, infrastructure, logs, browser monitoring, synthetics and mobile.
Measure is a mobile first, open source New Relic alternative.
## Full session context on every issue
New Relic gives you stack traces, breadcrumbs and interaction traces, and optionally Mobile Session Replay with several sampling options.
Measure attaches a full [Session Timeline](/product/session-timelines) with gestures, navigation, network calls, lifecycle events and custom spans to every crash, ANR and error and you only pay for the data used as a whole.
The key difference is transparency. Measure is open source, the platform that stores your user data is transparent, and you never have to send your data to a proprietary, locked platform.
## Adaptive capture, not fixed sampling
New Relic offers several sampling strategies. Some of these are server controlled but changing other sample rates means shipping an app update with new SDK settings.
Measure captures full session context by default, and with [Adaptive Capture](/product/adaptive-capture) you can tune what you collect remotely, without shipping an app update.
Dial up on new releases or when chasing tricky production issues, dial down whenever you need to.
## Fully open source
New Relic open sources its mobile agents, but the backend and dashboard are proprietary. You can look into the SDK, but you can't see or run the platform that ingests and stores your data.
Measure is [fully open source](https://github.com/measure-sh/measure). Read it, run it, self-host it, audit the pipeline and if you think something can be done better, send a pull request.
## Simple, predictable pricing
New Relic charges on data ingest and user seats. This means adding teammates and ingesting more data both push the bill up.
Measure has a single, transparent [price](/pricing) based on how much data you use. No per-seat fees, no separate product meters. With [Adaptive Capture](/product/adaptive-capture) you can dial collection up or down without rolling out app updates to control your costs even better.
## Built for mobile, by mobile devs
New Relic monitors infrastructure, APM, logs, browser, synthetics, security and more across one expansive platform. Mobile is one surface among many, and the defaults, dashboards, product decisions and roadmap are shaped by the whole platform rather than by the needs of mobile devs alone.
Measure is built only for mobile. [Crashes & ANRs](/product/crashes-and-anrs), [App Health](/product/app-health), [Performance Traces](/product/performance-traces), [Network Performance](/product/network-performance), [Bug Reports](/product/bug-reports) and [User Journeys](/product/user-journeys) are all designed around how mobile apps actually break in production.
Mobile is not a part of our product, it is the whole product.
## Measure vs New Relic
| Capability | Measure | New Relic |
| --- | --- | --- |
| Crash reporting with full session timelines | ✓ | Crash reports with optional Session replays |
| ANR detection with full session timelines | ✓ | ANRs with optional Session replays |
| Performance traces | ✓ | ✓ |
| Network monitoring | ✓ | ✓ |
| User journeys | ✓ | ✓ |
| In-app bug reports | ✓ | ✗ |
| Session timeline on every issue | ✓ | Session replay, sampled |
| Dynamic Sampling with Adaptive Capture | ✓ | Sampled, partial remote control |
| Auto-captured context | Gestures, navigation, network, lifecycle | Interactions, network, handled exceptions, breadcrumbs |
| Pricing | Simple pricing based on data usage | Per-GB data ingest plus per-user seats |
| Open Source | Apache 2.0 (OSI open source) | SDKs only |
| Self-hostable | ✓ | ✗ |
| Public roadmap & issue tracker | ✓ | SDK repos only |
| Mobile focus | ✓ | One small part of a huge platform |
Get started:
---
Source: https://measure.sh/pricing
---
# Pricing
Simple pricing based on the data used. No stressing over seat limits. No need to buy artificial bundles of crashes and spans - just track what you need to get to the root cause faster.
## Free — $0 per month
- 5 GB per month
- 30 days retention
- No credit card needed
## Pro — $50 per month
- 25 GB per month included
- 90 days retention
- Extra data charged at $2.00 per GB/month
Control costs with [Adaptive Capture](/product/adaptive-capture) · No Seat Limits · No Artificial Bundles
Get started:
---
Source: https://measure.sh/product/adaptive-capture
---
# Adaptive Capture
Most monitoring data is never read but ends up inflating your costs 💰. Adaptive Capture lets you capture what matters based on changing needs.
Need more data during a product launch or incident? Simply tweak your collection parameters to capture additional context when it matters most and collect only the essentials when things are running smoothly.
The best part? No need to roll out app updates! When you change your captures settings, our servers propagate the changes to our SDK seamlessly.
No more worrying about bloated costs or wasted data, Adaptive Capture lets you get the data you need, when you need it.
Get started:
---
Source: https://measure.sh/product/app-health
---
# App Health
Keep your finger on the pulse of your app's performance with comprehensive health monitoring that goes beyond the basics.
App Health gives you fast insights into the metrics that matter most - from error rates, error rates as perceived by users, app adoption and app size to precise launch time measurements across cold, warm and hot starts.
With App Health, you can proactively identify and address performance issues before they impact your users leading to a smooth rollout every time.
Get started:
---
Source: https://measure.sh/product/bug-reports
---
# Bug Reports
Empower your users to report issues directly from your app with a device shake or using your own custom button.
Bug Reports automatically capture everything that matters - device information, app version, network conditions and the exact timestamp alongside the user's description and screenshots.
Every bug report links directly to the complete session timeline, so you can see exactly what the user experienced, review the sequence of events and identify the root cause without stumbling around in the dark.
Bug Reports allows you to skip the email threads, support tickets and the back-and-forth asking users to remember what they were doing - your users describe the problem in their own words and you get all the technical data you need to solve it.
Get started:
---
Source: https://measure.sh/product/crashes-and-anrs
---
# Crashes and ANRs
Get instant visibility into every exception with detailed crash reports that include full stack traces, device information, OS versions and intelligent analysis of the sequence of user actions that led to the failure.
Our Common Path feature reconstructs the user journey before each crash, showing you what screens they visited, which actions they took, what API calls were and several other important signals.
Path analysis combined with comprehensive stack traces and thread-level details, gives you everything you need to reproduce issues effectively and ship fixes with confidence.
Get started:
---
Source: https://measure.sh/product/mcp
---
# MCP
Connect Measure with your favorite coding agents through the Model Context Protocol.
MCP lets AI coding assistants like Claude, Codex and Gemini access your errors, performance traces, session timelines and bug reports directly in your development workflow.
With MCP, you can simply ask your AI assistant to look up an error, get the full context including stack traces and session timelines leading to the issue and harness the power of AI to ship fixes faster than ever before.
Get started:
---
Source: https://measure.sh/product/network-performance
---
# Network Performance
Monitor the health and performance of every network request your app makes. Instantly see HTTP status code distributions over time, giving you a clear picture of how your API layer is performing at a glance.
Drill into your top endpoints ranked by latency, error rate and request frequency to pinpoint exactly which calls are slowing down your app or failing silently. Visualize when specific endpoints are called during a session to understand request patterns and timing.
With Network Performance, you can proactively catch degraded endpoints, reduce error rates and optimize the API calls that matter most to your users.
Get started:
---
Source: https://measure.sh/product/performance-traces
---
# Performance Traces
Measure exactly what matters for your app's user experience by instrumenting critical operations in your codebase.
Performance traces let you understand how API fetches, complex code operations and UI rendering stack up within a single user flow or aggregate across millions of sessions, with waterfall charts that make bottlenecks immediately obvious.
Every trace includes rich context such as device type and network conditions and links to a full session timeline so you can spot patterns and correlate slowdowns within specific environments.
Whether you're reducing checkout time, speeding up content loading or improving screen transitions, Performance Traces give you the quantitative data you need to make precise improvements.
Get started:
---
Source: https://measure.sh/product/session-timelines
---
# Session Timelines
Debug issues faster by replaying the exact sequence of events that led to a crash or performance problem.
Session Timeline captures the complete story - see which API call failed, what the user clicked right before an error occurred and how your app's resources were behaving at that precise moment.
With Session Timelines, you can stop guessing and have the full context you need to identify and fix root causes in an easy-to-navigate timeline.
Get started:
---
Source: https://measure.sh/product/user-journeys
---
# User Journeys
See the full picture of user behavior with beautiful flow diagrams that reveal the actual paths users take through your app.
User Journeys automatically map every screen transition, showing you which flows are most popular, where users drop off and which navigation patterns you never anticipated. Easily add your own screens and views to enrich them further.
Toggle between normal path analysis and exception view to see exactly where crashes and ANRs interrupt user flows. If users consistently crash when navigating from Product List to Product Detail screens, you'll see it highlighted with crash counts and session volumes. Click any path or exception to drill into the details and investigate further.
Whether you're redesigning navigation, prioritizing feature work or debugging issues in conversion funnels, User Journeys transforms complex behavioral data into clear, actionable visualizations that help you build better experiences.
Get started:
---
Source: https://measure.sh/security
---
# Security
At Measure, we recognize that security is fundamental to the trust placed in our open-source software and Measure Cloud (our managed SaaS offering).
Security is a core priority throughout the development, deployment and maintenance of our systems, and we adhere to established industry best practices to safeguard code, data and operations.
This policy outlines the principles, standards and controls that guide our commitment to maintaining the confidentiality, integrity and availability of our software, infrastructure and services.
## Open Source Transparency
Measure is fully open-source, and its source code is publicly available on [GitHub](https://github.com/measure-sh/measure). This transparency allows continuous review by the open-source community, fostering early identification and remediation of potential security issues.
## Supply Chain Security
Dependencies are regularly audited through GitHub [Dependabot](https://github.com/measure-sh/measure/security/dependabot) and code scanning tools, including [secret scanning](https://github.com/measure-sh/measure/security/secret-scanning), to detect and address vulnerabilities promptly. We ensure timely updates to dependencies to mitigate risks. An up-to-date [Software Bill of Materials](https://github.com/measure-sh/measure/network/dependencies) (SBOM) is maintained, and users are encouraged to inspect or export it for their own assessments.
## Authentication & Authorization
**Open Source (Self Hosted)**: Authentication and authorization are provided via Google and GitHub OAuth 2.0 protocols, strictly following the latest version of the [OAuth](https://oauth.net/specs/) standards. We use JSON Web Tokens (JWT) with a short expiry to minimize potential exploitation. We do not ask for or store user passwords, eliminating password-based vulnerabilities. Database credentials for Postgres and ClickHouse are generated using cryptographically secure algorithms via OpenSSL, unique to each installation. All communications with the software should be conducted over secure channels (TLS 1.2 or higher) when exposing APIs externally.
**Measure Cloud**: Authentication is managed centrally, with the same OAuth 2.0 and JWT standards applied. Infrastructure and secret management follow cloud security best practices, including encryption at rest and in transit. All Measure APIs use TLS 1.2 or higher for encryption in transit to protect data integrity and confidentiality. Private keys and sensitive credentials are securely stored and managed using [Google Secret Manager](https://cloud.google.com/security/products/secret-manager). Role-based access controls and centralized key management are enforced.
## Data Security
**Open Source (Self Hosted)**: Measure does not process or store sensitive customer data by design. All data is stored within the user's infrastructure. Users are responsible for performing security assessments and implementing safeguards appropriate to their environment.
**Measure Cloud**: Customer data is processed and stored within Measure Cloud infrastructure, hosted on Google Cloud Platform. All Google Cloud Storage (GCS) buckets are encrypted at rest using Google-managed encryption keys with the **AES-256** algorithm. Data in transit, including API requests and responses, is encrypted using **TLS 1.2** or higher. We apply strict access controls, monitoring and regular security reviews to ensure data security. Our architecture follows the principle of least privilege and enforces separation between customer environments. Measure Cloud adheres to Google's security best practices, as outlined in the [Google Cloud Security Best Practices Center](https://cloud.google.com/security/best-practices).
## Data Retention
**Session Data**: All session-related data is retained only according to the user-configured application data retention settings in the Measure Dashboard. Users have full control over retention periods for their applications.
**Crash and ANR Metadata**: We retain minimal crash and ANR (Application Not Responding) metadata solely to facilitate the identification and resolution of recurring issues in future application sessions. This data is anonymized and does not contain personally identifiable information (PII) by design.
## Monitoring for Performance & Reliability
We continuously monitor the health, availability and performance of our software using industry-standard observability tools to ensure operational reliability. Monitoring is designed to detect and address potential security issues proactively. Collected data does not include customer application data or personally identifiable information (PII) by design and is used solely to maintain performance, stability and security.
## Vulnerability Reporting
We encourage responsible disclosure of security vulnerabilities via [GitHub's Security Advisory](https://github.com/measure-sh/measure?tab=security-ov-file) process. Potential security issues may also be reported by emailing for prompt investigation and remediation.
Get started:
---
Source: https://measure.sh/sentry-alternative
---
# Looking for Sentry alternatives?
Sentry is a popular error monitoring tool with roots in the web dev world. Mobile support is a more recent expansion to the core error monitoring platform.
Measure is a mobile first, open source Sentry alternative.
## Full session context on every issue
Sentry gives you stack traces and breadcrumbs out of the box with Session Replays billed separately. If you want full context on every error, you will need to turn on Session Replays for all of them and accommodate the considerable cost increase.
Measure attaches a full [Session Timeline](/product/session-timelines) with gestures, navigation, network calls, lifecycle events and custom spans to every crash, ANR and error and you only pay for the data used as a whole.
You see exactly what the user did and what the app did, on every issue, without any compromise on the context.
## Adaptive capture, not fixed sampling
Sentry uses client-side sampling. You set a sample rate for traces and replays and decide up front what fraction to keep.
Measure captures full session context by default, and with [Adaptive Capture](/product/adaptive-capture) you can tune what you collect remotely, without shipping an app update.
Dial up sample rates on new releases or when chasing tricky production issues, dial down whenever you need to.
## Fully open source
Sentry uses a custom source-available rather than OSI open source: its main application and dashboard ship under the Functional Source License (FSL) with only the SDKs being MIT and the main application only going Apache 2.0 after 2 years.
Measure is [fully open source](https://github.com/measure-sh/measure). Read it, run it, self-host it, audit the pipeline and if you think something can be done better, send a pull request.
## Simple, predictable pricing
Sentry bills across a range of separate features: errors, spans, replays all cost different amounts across various tiers which makes it harder to predict costs as your app scales up.
Measure has a single, transparent [price](/pricing) based on how much data you use. No per-seat fees, no separate product meters. With [Adaptive Capture](/product/adaptive-capture) you can dial collection up or down without rolling out app updates to control your costs even better.
## Built for mobile, by mobile devs
Sentry monitors servers, cloud, serverless, frontend, games and mobile across dozens of SDKs. Mobile is one platform among many, and the defaults, platform decisions, dashboards and product roadmap are shaped by the whole platform rather than by the needs of mobile devs alone.
Measure is built only for mobile. [Crashes & ANRs](/product/crashes-and-anrs), [App Health](/product/app-health), [Performance Traces](/product/performance-traces), [Network Performance](/product/network-performance), [Bug Reports](/product/bug-reports) and [User Journeys](/product/user-journeys) are all designed around how mobile apps actually break in production.
Mobile is not a part of our product, it is the whole product.
## Measure vs Sentry
| Capability | Measure | Sentry |
| --- | --- | --- |
| Crash reporting with full session timelines | ✓ | Crash reports with breadcrumbs, Session replay billed separately |
| ANR detection with full session timelines | ✓ | ANRs with breadcrumbs, Session replay billed separately |
| Performance traces | ✓ | ✓ |
| Network monitoring | ✓ | ✓ |
| User journeys | ✓ | ✗ |
| In-app bug reports | ✓ | ✓ |
| Session timeline on every issue | ✓ | Session Replay billed separately |
| Dynamic Sampling with Adaptive Capture | ✓ | Client side only sampling |
| Auto-captured context | Gestures, navigation, network, lifecycle | Breadcrumbs, deeper context via Replay |
| Pricing | Simple pricing based on data usage | Separate quotas for errors, spans, replays, profiling, cron, uptime & logs |
| Open Source | Apache 2.0 (OSI open source) | FSL — source-available, Apache 2.0 after 2 years |
| Self-hostable | ✓ | ✓ |
| Public roadmap & issue tracker | ✓ | ✓ |
| Mobile focus | ✓ | One of many Sentry platforms |
Get started:
---
Source: https://measure.sh/why-measure
---
# Why Measure?
There are several mobile app monitoring tools in the market. What is different between these tools is the core philosophy of the teams building them which affects the products in small and large ways.
## Beyond Crashes
Measure is focused on giving the full picture of apps in production to mobile developers and is not just limited to basic error tracking.
With advanced automated capture techniques and full [Session Timelines](/product/session-timelines), Measure allows you to get the full context of errors and performance issues as they happen in the wild.
If you're looking to truly understand what issues occur in your app, how they impact users and how to debug them quickly, Measure is the right tool for you.
## Mobile Focus
Measure is built by mobile developers for mobile developers. Every feature, every design decision and every trade-off is made with mobile app production monitoring in mind.
Mobile is not an add-on or afterthought to an observability product, it **is** the product.
If you care about your app being treated with the respect and focus it deserves, Measure is the perfect match for you.
## Open Source
Measure is [fully open source](https://github.com/measure-sh/measure). This means our code is open to scrutiny and community contributions which we strongly believe leads to a better product.
If you value transparency, flexibility and open development, Measure is the right community for you.
## Simple Pricing
Measure offers clear and transparent [pricing](/pricing) based on data and retention. There are no bundles, hidden charges, seats or tiers (although we do offer discounts for high volume apps). You can send any combination of errors, metrics, spans etc without worrying about exceeding artificial limits.
Further, with [Adaptive Capture](/product/adaptive-capture), you can optimize your data collection to only capture what you need and adjust it dynamically without rolling out app updates, reducing costs and data bloat.
If you hate playing with excel sheets and pricing calculators to figure out your monthly bill and would like to adjust your data collection based on changing needs, Measure is the right choice for you.
Get started:
## 6. Start Measure services
```sh
sudo ./install.sh
```
## 7. Run data back filling script
Perform this step to complete the migration. Measure dashboard will not work properly until these scripts are run.
```sh
sudo ./migrations/v0.10.x-data-backfills-1.sh
```
```sh
sudo ./migrations/v0.10.x-data-backfills-2.sh
```
```sh
sudo ./migrations/v0.10.x-read-optim.sh
```
---
Source: https://measure.sh
---
# Mobile apps break, get to the root cause faster.
Measure helps mobile teams monitor and fix crashes, ANRs, bugs, and performance issues. The open source alternative to **Firebase Crashlytics**.
## Trusted by high growth mobile teams
Kuku FM, Hoichoi, Country Delight, Dashreels, Turtlemint, Astro, Allofresh, SMC India, Even, Karya.
## One dashboard, Complete context
## Collect what you need, Only when you need it
Most monitoring data rots away in a warehouse and runs up your costs 💰. Our [Adaptive Capture](/product/adaptive-capture) feature lets you control and dynamically change what data to collect without needing to roll out app updates.
## Intelligent debugging, Seamless integration
Connect Measure with your favorite coding agents through our [MCP](/product/mcp) server. Let your coding agent query errors, traces and session timelines directly in your development workflow.
## Tried it, Loved it ❤️
> I've been using measure.sh lately to monitor my mobile apps and host it myself and it has been a delight. Definitely recommend it to anyone looking for an open source mobile app monitoring tool.
>
> — Hussain Mustafa ([source](https://x.com/husslingaround/status/1855983892294983980))
> I'm surprised this hasn't gained more attention yet — it's incredibly exciting for the mobile space, where we definitely lack observability and measure addresses so many of those gaps.
>
> — Aditya Pahilwani ([source](https://x.com/AdityaPahilwani/status/1843561672188821520))
> When I stumbled upon measure.sh, I was blown away! Crash-free sessions improved dramatically — now hitting a mythical 99.99% consistently. Logs, metrics, traces — finally stitched together in one view. Our hot & warm app startup times? Looking great!
>
> — Sutirth Chakravarty ([source](https://www.linkedin.com/posts/sutirthchakravarty_circa-early-2024-i-had-the-chance-to-attend-activity-7317570327520124928-yo1s))
> The good folks at measure.sh have been working on a mobile app monitoring platform for several months now and have open-sourced it. Do check it out and show it some love! This is quite a strong team that led several mobile platform initiatives at Gojek.
>
> — Ragunath Jawahar ([source](https://x.com/ragunathjawahar/status/1825490936857522290))
> I'm personally a fan. Not just of the product, but of the minds behind it. It's built by some of the sharpest mobile engineers I've admired for years. Folks who live and breathe performance, scaling, and observability. This isn't just another tool. It's crafted with intent, care, and deep expertise.
>
> — Iniyan Murugavel ([source](https://www.linkedin.com/posts/iniyanarul_crashes-were-observed-first-on-measure-activity-7316853914589413377-gFd_/))
> Looking for a way to keep tabs on your mobile apps? How about using a free and open-source solution? Consider exploring measure.sh!
>
> — Tuist ([source](https://www.linkedin.com/posts/tuistio_github-measure-shmeasure-measure-is-an-activity-7312413362292719616-DUlU))
## Built For Mobile Devs
For us, Mobile is not an add-on to an observability product. It **is** the product. Measure is built by mobile engineers, for mobile engineers.
- **Open Source** — [Star us on GitHub](https://github.com/measure-sh/measure).
- **Simple Pricing** — Pay only for the [data you use](/pricing). No seat limits or feature restrictions.
- **Every mobile platform** — Android, iOS, Flutter, React Native (soon).
Get started:
---
Source: https://measure.sh/about
---
# For mobile engineers, by mobile engineers
We built Measure to solve the unique challenges mobile developers face in monitoring production apps.
After spending years in the trenches building mobile apps at scale, we understood that existing tools that are often web and backend centric don't address mobile-specific needs.
For us, mobile is not an add-on to an observability product. Mobile **is** the product.
We strongly believe that tools for mobile developers can and should be better and that's what drives us everyday.
## Team
- **[Gandharva Kumar](https://www.linkedin.com/in/gandharvakr/)** — CEO
- **[Anup Cowkur](https://www.linkedin.com/in/anupcowkur/)** — CTO
- **[Abhay Sood](https://www.linkedin.com/in/abhaysood/)** — Head of Mobile
- **[Debjeet Biswas](https://www.linkedin.com/in/debjeet-biswas-9b4337281/)** — Head of Infra
- **[Adwin Ross](https://www.linkedin.com/in/adwin-ronald-ross/)** — Mobile Engineer
## Investors
Picus Capital · DeVC · Astir Ventures
## Angels
- Mustafa Ali — Head of Mobile, Shopify
- Kunal Shah — Founder, CRED
- Misbah Ashraf — Co-Founder, Jar
- Vatsal Singhal — Co-Founder, Ultrahuman
- Anshuman Bajoria — Strategy and Operations, Revolut
- Anuj Bhagat — Product, Google
- Sudhanshu Raheja — President, GoTo Financial
- Sidu Ponnappa — CEO, realfast
- Abhinit Tiwari — Head of Design, Gojek
- Ranjan Sakalley — Co-Founder, base14
- Gaurav Batra — Co-Founder, Semaai
- Paul Meinshausen — CEO, Aampe
Get started:
---
Source: https://measure.sh/bugsnag-alternative
---
# Looking for Bugsnag alternatives?
Bugsnag is an established error monitoring and app stability tool covering mobile alongside web and backend across dozens of platforms.
Measure is a mobile first, open source Bugsnag alternative.
## Full session context on every issue
Bugsnag gives you stack traces with breadcrumb trails of what happened before the error. Breadcrumbs have a max limit and there is no visual replay of the session.
Measure attaches a full [Session Timeline](/product/session-timelines) with gestures, navigation, network calls, lifecycle events and custom spans to every crash, ANR and error, with no hard limit on what you can see.
You see exactly what the user did and what the app did, on every issue, without any compromise on the context.
## Adaptive capture, not quota sampling
Bugsnag keeps you limited to the tier you pay for by sampling. Performance data is sampled server-side so it fits your span quota, and errors are metered against a monthly event quota. In case of traffic spikes or sudden user growth, you would end up with less visibility into your system when you need more.
Measure captures full session context by default, and with [Adaptive Capture](/product/adaptive-capture) you can tune what you collect remotely, without shipping an app update.
Dial up on new releases or when chasing tricky production issues, dial down whenever you need to.
## Fully open source
Bugsnag publishes its notifier SDKs on GitHub under the MIT license, but the backend and dashboard are proprietary. You can read the SDK but the rest of the platform is opaque.
Measure is [fully open source](https://github.com/measure-sh/measure). Read it, run it, self-host it, audit the pipeline and if you think something can be done better, send a pull request.
## Simple, predictable pricing
Bugsnag meters two separate things, error events and performance spans, each against its own monthly quota. Exceeding quotas means sampling or overage.
Measure has a single, transparent [price](/pricing) based on how much data you use. No separate product meters. With [Adaptive Capture](/product/adaptive-capture) you can dial collection up or down without rolling out app updates to control your costs even better.
## Built for mobile, by mobile devs
Bugsnag monitors mobile, web and backend across 50+ platforms and is now one product inside SmartBear's larger testing and monitoring suite. Mobile is one player among many, and the defaults, platform decisions, dashboards and roadmap are shaped by the whole portfolio rather than by the needs of mobile devs alone.
Measure is built only for mobile. [Crashes & ANRs](/product/crashes-and-anrs), [App Health](/product/app-health), [Performance Traces](/product/performance-traces), [Network Performance](/product/network-performance), [Bug Reports](/product/bug-reports) and [User Journeys](/product/user-journeys) are all designed around how mobile apps actually break in production.
Mobile is not a part of our product, it is the whole product.
## Measure vs Bugsnag
| Capability | Measure | Bugsnag |
| --- | --- | --- |
| Crash reporting with full session timelines | ✓ | Crash reports with limited breadcrumbs |
| ANR detection with full session timelines | ✓ | ANRs with limited breadcrumbs |
| Performance traces | ✓ | ✓ |
| Network monitoring | ✓ | ✓ |
| User journeys | ✓ | ✗ |
| In-app bug reports | ✓ | ✗ |
| Session timeline on every issue | ✓ | Limited breadcrumbs only |
| Dynamic Sampling with Adaptive Capture | ✓ | Quota-driven sampling |
| Auto-captured context | Gestures, navigation, network, lifecycle | Navigation, network, taps via limited breadcrumbs |
| Pricing | Simple pricing based on data usage | Separate quotas for error events & performance spans |
| Open Source | Apache 2.0 (OSI open source) | SDKs only |
| Self-hostable | ✓ | Enterprise on-premise |
| Public roadmap & issue tracker | ✓ | SDK repos only |
| Mobile focus | ✓ | One of many platforms |
Get started:
---
Source: https://measure.sh/crashlytics-alternative
---
# Looking for Firebase Crashlytics alternatives?
Firebase Crashlytics is a free and popular crash reporting tool that many apps start with.
Measure is a mobile first, open source Firebase Crashlytics alternative.
## Beyond Crashes
Crashlytics handles basic crash reporting but requires more tooling to complete the mobile app monitoring picture.
Performance traces need the performance monitoring add-on. Understanding what the user was doing when the crash happened requires enabling Google Analytics and manually instrumenting breadcrumb logs. Bug reporting requires third party tooling. Data analysis needs BigQuery export which is charged separately. The number of SDKs in your app and the tools you need to look at keep expanding.
Measure unifies [Crashes & ANRs](/product/crashes-and-anrs), [Network Performance](/product/network-performance), [Performance Traces](/product/performance-traces), [App Health](/product/app-health), [Bug Reports](/product/bug-reports) and [User Journeys](/product/user-journeys) in one product. Every issue comes with a full Session Timeline which is auto collected for you without having to manually instrument every user interaction in your app.
One SDK, one dashboard, one place to look so you can stop stitching context and get to the root cause faster.
## Full session context, not just stack traces
Crash reports in Crashlytics come with stack traces and manually instrumented breadcrumbs. Taps, navigations, network calls or lifecycle events require manual instrumentation which needs to be updated and synced when your app code changes in new releases.
Measure auto-captures gestures, navigation, lifecycle events, network calls and custom spans, and replays them as a [Session Timeline](/product/session-timelines) attached to every crash, ANR or error.
Measure makes it easy to see what the user did, what the app did and where things went wrong, without instrumenting every screen by hand.
## Open source
The Crashlytics SDKs are open source on GitHub, but the backend and dashboard are closed and run only on Google's proprietary infrastructure.
Measure is [fully open source](https://github.com/measure-sh/measure). Read it, run it, self-host it, audit the pipeline and if you think something can be done better, send a pull request.
## Simple, transparent pricing
Crashlytics itself is free. The catch is that going further usually means stepping into the rest of the Firebase and GCP pricing ecosystem. BigQuery exports for data analysis, Cloud Functions for alerting and other paid GCP services require separate payment for advanced operations on your data.
Measure has a single, transparent [price](/pricing) based on how much data you use. No per-seat charges, no hidden product bundles. With [Adaptive Capture](/product/adaptive-capture) you can dial collection up or down without rolling out app updates to control costs further.
## Built for mobile, by mobile devs
Crashlytics sits inside the larger Firebase suite where mobile is one product line among many. The product roadmap and platform decisions compete with the priorities of a much bigger platform.
Measure is built only for mobile. [Crashes & ANRs](/product/crashes-and-anrs), [App Health](/product/app-health), [Performance Traces](/product/performance-traces), [Network Performance](/product/network-performance), [Bug Reports](/product/bug-reports) and [User Journeys](/product/user-journeys) are all designed around how mobile apps actually break in production.
Mobile is not a part of our product, it is the whole product.
## Measure vs Firebase Crashlytics
| Capability | Measure | Firebase Crashlytics |
| --- | --- | --- |
| Crash reporting with full session timelines | ✓ | Crash reports with manual breadcrumbs |
| ANR detection with full session timelines | ✓ | ANRs with manual breadcrumbs |
| Performance traces without sampling | ✓ | Sampled |
| Network monitoring without sampling | ✓ | Sampled |
| User journeys | ✓ | Needs Google Analytics |
| In-app bug reports | ✓ | ✗ |
| Session timeline on every issue | ✓ | ✗ |
| Dynamic Sampling with Adaptive Capture | ✓ | ✗ |
| Auto-captured context | Gestures, navigation, network, lifecycle | Screen views if Google Analytics is enabled but rest needs manual instrumentation |
| Pricing | Simple pricing based on data usage | Free crash reporting but complex Google Analytics + BigQuery pricing for advanced users |
| Open Source | Apache 2.0 (OSI open source) | SDKs only |
| Self-hostable | ✓ | ✗ |
| Public roadmap & issue tracker | ✓ | SDK repos only |
| Raw data access | Data export whenever you need it | Paid export to BigQuery only |
| Mobile focus | ✓ | One of many Firebase products |
Get started:
---
Source: https://measure.sh/datadog-alternative
---
# Looking for Datadog alternatives?
Datadog is a comprehensive observability platform with roots in infrastructure and backend monitoring, spanning servers, cloud, APM, logs, security, web and mobile.
Measure is a mobile first, open source Datadog alternative.
## Full session context on every issue
Datadog gives you stack traces and auto-captured events out of the box with Mobile Session Replays billed separately. If you want full context on every error, you will need to turn on Mobile Session Replays for all of them and accommodate the significant cost increase.
Measure attaches a full [Session Timeline](/product/session-timelines) with gestures, navigation, network calls, lifecycle events and custom spans to every crash, ANR and error and you only pay for the data used as a whole.
You see exactly what the user did and what the app did, on every issue, without any compromise on the context.
## Adaptive capture, not fixed sampling
Datadog uses client-side sampling. You set a session sample rate, with a separate replay sample rate applied on top and decide up front what fraction to keep.
Measure captures full session context by default, and with [Adaptive Capture](/product/adaptive-capture) you can tune what you collect remotely, without shipping an app update.
Dial up sample rates on new releases or when chasing tricky production issues, dial down whenever you need to.
## Fully open source
Datadog publishes its mobile SDKs as open source, but the backend and dashboard are proprietary. You can read the SDK, but you can't see or run the platform that ingests and stores your data.
Measure is [fully open source](https://github.com/measure-sh/measure). Read it, run it, self-host it, audit the pipeline and if you think something can be done better, send a pull request.
## Simple, predictable pricing
Datadog is metered across a long list of separate SKUs. RUM sessions are split into tiers, Mobile Session Replay is billed on top, and per-host APM, infrastructure and logs have their own price lists.
Measure has a single, transparent [price](/pricing) based on how much data you use. No per-seat fees, no separate product meters. With [Adaptive Capture](/product/adaptive-capture) you can dial collection up or down without rolling out app updates to control your costs even better.
## Built for mobile, by mobile devs
Datadog monitors infrastructure, servers, cloud, APM, logs, security and frontend across hundreds of integrations. Mobile is one small corner of a sprawling observability platform, and the defaults, dashboards, product decisions and roadmap are shaped by the whole platform rather than by the needs of mobile devs alone.
Measure is built only for mobile. [Crashes & ANRs](/product/crashes-and-anrs), [App Health](/product/app-health), [Performance Traces](/product/performance-traces), [Network Performance](/product/network-performance), [Bug Reports](/product/bug-reports) and [User Journeys](/product/user-journeys) are all designed around how mobile apps actually break in production.
Mobile is not a part of our product, it is the whole product.
## Measure vs Datadog
| Capability | Measure | Datadog |
| --- | --- | --- |
| Crash reporting with full session timelines | ✓ | Crash reports with auto-captured events, session replay sampled & billed separately |
| ANR detection with full session timelines | ✓ | ANRs, session replay sampled & billed separately |
| Performance traces | ✓ | ✓ |
| Network monitoring | ✓ | ✓ |
| User journeys | ✓ | ✓ |
| In-app bug reports | ✓ | ✗ |
| Session timeline on every issue | ✓ | Session replay, sampled & billed separately |
| Dynamic Sampling with Adaptive Capture | ✓ | Client side only sampling |
| Auto-captured context | Gestures, navigation, network, lifecycle | Actions, views, network, errors |
| Pricing | Simple pricing based on data usage | Separate SKUs for RUM session tiers, replay, APM, infra & logs |
| Open Source | Apache 2.0 (OSI open source) | SDKs only |
| Self-hostable | ✓ | ✗ |
| Public roadmap & issue tracker | ✓ | SDK repos only |
| Mobile focus | ✓ | One small part of a huge platform |
Get started:
---
Source: https://measure.sh/embrace-alternative
---
# Looking for Embrace alternatives?
Embrace is a mobile and web observability platform that offers crash reporting, ANR tracking, network monitoring and performance traces.
Measure is a mobile first, open source Embrace alternative.
## Full session context on every issue
Embrace and Measure both attach a full session view to every crash, ANR and error and capture it automatically.
Measure records gestures, navigation, network calls, lifecycle events and custom spans into a full [Session Timeline](/product/session-timelines) on every issue.
The key difference is transparency. Measure is open source, the platform that stores your user data is transparent, and you never have to send your data to a proprietary, locked platform.
## Adaptive capture, not all-or-nothing
Measure and Embrace both allow you to capture full session data without sampling. Where they differ is control: Embrace captures everything and bills per session, so full context means paying for every session your app generates which can be significant at scale.
Measure captures full session context, but with [Adaptive Capture](/product/adaptive-capture) you can tune what you collect remotely, without shipping an app update.
Dial up on a new release, dial down to cut cost or noise. You decide how much you collect, and change it whenever you need to.
## Fully open source
Embrace open sources its SDKs but the backend and dashboard that ingest, store and surface your data are locked behind a proprietary platform with no auditability.
Measure is [fully open source](https://github.com/measure-sh/measure). Run the entire stack yourself, audit the pipeline end to end, keep your data on your own infrastructure if you choose, and if something can be done better, send a pull request.
## Simple, predictable pricing
Embrace charges per session which means a session with barely any activity matters the same as one with lots of interactions.
Measure has a single, transparent [price](/pricing) based on how much data you actually ingest which is a much more practical metric as it relates directly to usage of the platform without meaningless sessions costing more than they need to. With [Adaptive Capture](/product/adaptive-capture) you can also tune collection anytime to keep costs in check.
## Built for mobile, by mobile devs
Embrace supports mobile and web monitoring. Mobile is one of the supported platforms, and the defaults, platform decisions, dashboards and product roadmap are shaped by the whole platform rather than by the needs of mobile devs alone.
Measure is mobile first and focused on mobile developers. [Crashes & ANRs](/product/crashes-and-anrs), [App Health](/product/app-health), [Performance Traces](/product/performance-traces), [Network Performance](/product/network-performance), [Bug Reports](/product/bug-reports) and [User Journeys](/product/user-journeys) are all shaped only by how mobile apps break in production.
Mobile is not a part of our product, it is the whole product.
## Measure vs Embrace
| Capability | Measure | Embrace |
| --- | --- | --- |
| Crash reporting with full session timelines | ✓ | ✓ |
| ANR detection with full session timelines | ✓ | ✓ |
| Performance traces | ✓ | ✓ |
| Network monitoring | ✓ | ✓ |
| User journeys | ✓ | ✓ |
| In-app bug reports | ✓ | ✗ |
| Session timeline on every issue | ✓ | ✓ |
| Dynamic Sampling with Adaptive Capture | ✓ | Always-on full capture |
| Auto-captured context | Gestures, navigation, network, lifecycle | Taps, views, network, lifecycle |
| Pricing | Simple pricing based on data usage | Per session |
| Open Source | Apache 2.0 (OSI open source) | SDKs only |
| Self-hostable | ✓ | ✗ |
| Public roadmap & issue tracker | ✓ | SDK repos only |
| Mobile focus | ✓ | Mobile and Web |
Get started:
---
Source: https://measure.sh/for/android
---
# Measure for Android
Measure is an open source, mobile first monitoring platform built for Android. Measure gives you all the context you need to decrease crash rates, increase app performance and deliver smoother experiences for your Android app users.
## Session Timelines
Every crash and ANR in your Android app arrives with a full [Session Timeline](/product/session-timelines). Replay the exact sequence of events that led to the issue — gestures, navigation, network calls, logs and lifecycle events — with CPU and memory signals right alongside.
Stop guessing from a stack trace and see exactly what the user and the app did leading up to the moment things went wrong.
## Detailed Stack Traces
Every [crash and ANR](/product/crashes-and-anrs) comes with a full stack trace captured across every thread, so you can figure out what each thread was doing, not just the one that threw the error.
Stack traces are automatically deobfuscated, mapping minified R8 and ProGuard output back to your original class and method names with their intact line numbers. Mapping files are automatically uploaded by our Gradle plugin so you can focus on fixing issues and let Measure handle the boring stuff.
## Performance Monitoring
Instrument the operations that matter most with [Performance Traces](/product/performance-traces). See how API fetches, database calls, expensive code paths and screen rendering stack up within a single user flow or across millions of sessions with waterfall charts that make bottlenecks obvious.
Traces carry rich device and app context linking back to full session timelines, so you can tie slow operations to the environment they happened in.
## App Health
Stay on top of every release with [App Health](/product/app-health). Track app adoption, crash-free and ANR-free sessions, error rates as your users actually perceive them, app size, and launch times across cold, warm and hot starts.
Spot a bad rollout early and fix it before it reaches the rest of your users.
## Bug Reports
Let users report problems the moment they see them with [Bug Reports](/product/bug-reports), triggered by a device shake or a call to the SDK from your own button. Each report captures device information, app version, network conditions and screenshots alongside the user's description, and links straight to the complete session timeline.
Skip the email threads and support ticket back-and-forth. Your users describe the issue in their own words and you get all the context you need to solve it.
## User Journeys
See the real paths users take through your app with [User Journeys](/product/user-journeys). Every screen transition is mapped automatically into clear flow diagrams, and the exception view shows exactly where issues interrupt those flows.
Short on time and figuring out what issues to prioritize? Easily see which paths are important to users so you can unblock them first.
## Network Monitoring
Watch every request your app makes with [Network Performance](/product/network-performance). See HTTP status code distributions over time and drill into your top endpoints ranked by latency, error rate and request frequency to find the calls slowing your app down.
Catch degraded endpoints early and optimize the API calls that matter most to your users.
## Coding Agents
Bring all of Measure's context into your favorite coding agents. The [Measure MCP server](/product/mcp) gives any coding agent access to your crashes, ANRs, performance traces and session timelines, straight from your IDE, editor or terminal.
Ask it to help you debug a crash, analyze user sessions or use it to set up an agentic issue triage and debug pipeline. Whether you're team Claude Code or Codex, or prefer open source agents and models, Measure fits right into your workflows.
Works with Claude Code, Cursor, Codex, Gemini CLI, Windsurf, Cline, opencode and Kilo Code.
Get started:
---
Source: https://measure.sh/for/flutter
---
# Measure for Flutter
Measure is an open source, mobile first monitoring platform built for Flutter. It brings together the full context behind every crash and error across your Dart and native code, so you can drive down crash and error rates, smooth out performance issues and deliver a delightful experience on both Android and iOS.
## Session Timelines
Every crash and error in your Flutter app comes with a complete [Session Timeline](/product/session-timelines) you can replay. Step back through the exact lead-up — gestures, navigation, network calls, logs and lifecycle events — with CPU and memory readings plotted right beside them.
Instead of reading an out-of-context Dart stack trace, you can see exactly what the user did and how the app responded just before things went wrong.
## Detailed Stack Traces
Every [crash and error](/product/crashes-and-anrs) carries a complete Dart stack trace, alongside any native crash from the Android or iOS side.
Stack traces are automatically deobfuscated, mapping both native and Dart code to your original class and method names with their intact line numbers. Let Measure deal with the tedious part so you can focus on debugging issues.
## Performance Monitoring
Wrap the operations that matter in [Performance Traces](/product/performance-traces). See how network requests, platform channels, expensive widget builds and rendering stack up within a single flow or across millions of sessions with waterfall charts that make the slow parts obvious.
Every trace comes with full device and app context and ties back to its session timeline, so a slow span never shows up without the conditions that produced it.
## App Health
Keep a close eye on every release with [App Health](/product/app-health). Follow adoption, crash-free sessions, user perceived error rates, app size, and launch times across your Android and iOS builds.
Notice a buggy rollout early and fix it before it spreads to the rest of your users.
## Bug Reports
Let users report a problem the second they notice it with [Bug Reports](/product/bug-reports), triggered by a device shake or from your own button through the SDK. Each report packages device details, app version, network conditions and a screenshot next to the user's description, and makes it easy to jump straight to the matching session timeline.
Forget the email threads and support ticket back-and-forth — your users explain the issue in their own words and you get every bit of context needed to resolve it.
## User Journeys
Follow the paths people take through your production app with [User Journeys](/product/user-journeys). Every screen transition is charted automatically into clear flow diagrams, and the exception view marks exactly where issues derail those flows.
Deciding what to fix first? See which routes carry the most users so you can clear the most frequent blockers.
## Network Monitoring
See every request your app makes with [Network Performance](/product/network-performance). Follow how HTTP status codes shift over time and drill into your heaviest endpoints, ranked by latency, error rate and call volume, to find the requests slowing down your app.
Catch failing endpoints early and tune the API calls your users depend on most.
## Coding Agents
Bring Measure's full context into the coding agents you already work with. The [Measure MCP server](/product/mcp) hands any agent your crashes, errors, performance traces and session timelines, directly from your IDE, editor or terminal.
Point it at a crash, work through user sessions, or build it into an agentic triage and debugging pipeline. Whether you're on Claude Code or Codex, or you prefer open source agents and models, Measure drops straight into your workflow.
Works with Claude Code, Cursor, Codex, Gemini CLI, Windsurf, Cline, opencode and Kilo Code.
Get started:
---
Source: https://measure.sh/for/ios
---
# Measure for iOS
Measure is an open source, mobile first monitoring platform built for iOS. Measure gives you the full context behind every crash and slowdown, so you can decrease crashes and errors, improve performance and deliver a smoother experience to your iOS app users.
## Session Timelines
Every crash and error in your iOS app gets a complete [Session Timeline](/product/session-timelines) attached. Step back through everything that led up to it — taps and gestures, screen navigation, network calls, logs and lifecycle events — with CPU and memory readings plotted right beside them.
Instead of working backwards from a lone stack trace, you can see exactly what the user did and how the app responded in the moments before things broke.
## Detailed Stack Traces
Every [crash report](/product/crashes-and-anrs) comes with a full stack trace captured across every thread, so you can see what each one was doing, not just the thread that crashed.
Traces are symbolicated automatically, turning raw memory addresses back into the original function names, files and line numbers from your Swift and Objective-C sources. Upload your dSYMs through the Xcode build phase or straight from your .xcarchive and let Measure handle the symbolication so you can stay focused on the fix.
## Performance Monitoring
Put traces around the operations you care about with [Performance Traces](/product/performance-traces). Watch how network requests, disk and database work, heavy code paths and screen rendering add up inside a single user flow or across millions of sessions with waterfall charts that make the slow parts jump out.
Each trace carries detailed device and app context and links back to the full session timeline, so a slow operation always comes with the conditions it ran under.
## App Health
Keep a close eye on every release with [App Health](/product/app-health). Follow adoption, crash-free sessions, the error rates your users actually perceive, app size, and launch times across cold, warm and hot starts.
Catch a bad rollout while it's still contained and fix it before it reaches the rest of your users.
## Bug Reports
Let users flag problems the instant they hit them with [Bug Reports](/product/bug-reports), triggered by a device shake or from your own button through the SDK. Every report bundles device details, app version, network conditions and a screenshot together with the user's note, and links straight to the matching session timeline.
No more long email threads or support ticket ping-pong. Users describe the issue in their own words while you get all the context needed to fix it.
## User Journeys
Trace the actual routes people take through your app with [User Journeys](/product/user-journeys). Screen-to-screen movement is mapped for you into clear flow diagrams, and the exception view shows you where issues degrade those flows.
Not sure what to tackle first? See at a glance which paths matter most to your users so you can prioritize effectively.
## Network Monitoring
Keep tabs on every request your app fires with [Network Performance](/product/network-performance). Track how HTTP status codes trend over time and dig into your busiest endpoints, ranked by latency, error rate and call volume, to surface the requests dragging your app down.
Spot failing endpoints early and tune the API calls that matter most to your users.
## Coding Agents
Pull all of Measure's context into the coding agents you already use. The [Measure MCP server](/product/mcp) opens up your crashes, performance traces and session timelines to any agent, right from your IDE, editor or terminal.
Have it dig into a crash, walk through user sessions, or wire it into an agentic triage and debugging pipeline. Whether you lean on Claude Code or Codex, or prefer open source agents and models, Measure slots straight into your workflow.
Works with Claude Code, Cursor, Codex, Gemini CLI, Windsurf, Cline, opencode and Kilo Code.
Get started:
---
Source: https://measure.sh/for/ipados
---
# Measure for iPadOS
Measure is an open source, mobile first monitoring platform with full support for iPadOS. It surfaces the complete context behind every crash and performance issue to help you cut crash and error rates, sharpen performance and keep your iPad app feeling effortless.
## Session Timelines
Every crash and error on iPad comes with a complete [Session Timeline](/product/session-timelines) you can replay. Walk back through the exact run-up to the failure — gestures, screen navigation, network calls, logs and lifecycle events — with CPU and memory readings plotted right alongside.
A stack trace only tells you where things broke. The timeline shows how your app got there and what the user was doing in the moments before failure.
## Detailed Stack Traces
Every [crash report](/product/crashes-and-anrs) carries a complete, multi-threaded stack trace, so you can inspect what each thread was up to, not just the one that failed.
Measure symbolicates them for you, mapping raw memory addresses back to the original function names, files and line numbers in your Swift and Objective-C code. Upload your dSYMs through the Xcode build phase or straight from your .xcarchive and let Measure worry about the symbolication so you can stay focused on the fix.
## Performance Monitoring
Wrap the operations that matter in [Performance Traces](/product/performance-traces). See how network requests, disk and database access, expensive code paths and the rendering of those larger iPad layouts accumulate within a single flow or across millions of sessions with waterfall views that make the slow parts obvious.
Every trace comes with full device and app context and ties back to its session timeline, so a slow span never shows up without the conditions that produced it.
## App Health
Track the health of every release in one place with [App Health](/product/app-health). Monitor adoption, error rates, launch times and more core app metrics in one unified view.
Notice a shaky rollout early and patch it before it spreads to the rest of your users.
## Bug Reports
Let people report a problem the second they run into it with [Bug Reports](/product/bug-reports), triggered by a shake or from a button you wire up through the SDK. Each one packages device details, app version, network conditions and a screenshot next to the user's own description, and allows you to jump straight to the matching session timeline.
Forget the back-and-forth of email and support tickets. Your users explain the issue in their own words and you get every bit of context needed to resolve it.
## User Journeys
Follow the real paths people take through your app with [User Journeys](/product/user-journeys). Every screen transition is charted automatically into clear flow diagrams, and the exception view marks exactly where issues derail those flows.
Deciding what to fix first? See which routes carry the most users so you can unblock the busiest ones ahead of the rest.
## Network Monitoring
See every request your app makes with [Network Performance](/product/network-performance). Follow how HTTP status codes shift over time and drill into your heaviest endpoints ranked by latency, error rate and call volume to find the requests degrading your app performance.
Catch endpoints going bad early and take care of the API calls your users depend on most.
## Coding Agents
Bring Measure's full context into the coding agents you already work with. The [Measure MCP server](/product/mcp) hands any agent your crashes, performance traces and session timelines, directly from your IDE, editor or terminal.
Point it at a crash, have it work through user sessions, or build it into an agentic triage and debugging pipeline. Whether you're on Claude Code or Codex, or you prefer open source agents and models, Measure drops straight into your workflow.
Works with Claude Code, Cursor, Codex, Gemini CLI, Windsurf, Cline, opencode and Kilo Code.
Get started:
---
Source: https://measure.sh/for/react-native
---
# Measure for React Native
Measure is an open source, mobile first monitoring platform built for React Native. Whether you use vanilla React Native or Expo, Hermes or JavaScriptCore, Measure gives you the full context behind every error across your JavaScript and native layers, so you can cut crash rates, tighten performance and ship a smoother experience on both Android and iOS.
## Session Timelines
Every error in your React Native app arrives with a complete [Session Timeline](/product/session-timelines). Replay the exact path to the issue — gestures, navigation, network calls, logs and lifecycle events — with CPU and memory readings right alongside.
Rather than piecing together a minified stack trace, you see exactly what the user did and how the app behaved in the moments before it broke.
## Detailed Stack Traces
Every [crash and error](/product/crashes-and-anrs) comes with a complete stack trace. JavaScript errors are symbolicated from your sourcemaps, so you read your own functions, files and line numbers instead of minified output, and crashes from the native Android and iOS layers are captured and mapped too.
Sourcemaps and native mapping files are uploaded automatically, so you can let Measure take care of the boring stuff and focus on fixing user issues.
## Performance Monitoring
Put traces around the operations that matter with [Performance Traces](/product/performance-traces). See how network requests, native modules, expensive JavaScript and screen rendering stack up within a single user flow or across millions of sessions with waterfall charts that make bottlenecks obvious.
Each trace carries rich device and app context and links back to the full session timeline, so a slow operation always comes with the environment it ran in.
## App Health
Stay on top of every release with [App Health](/product/app-health). Track adoption, crash-free sessions, app size, and launch times for your Android and iOS builds alike.
Spot a bad rollout early and fix it before it reaches the rest of your users.
## Bug Reports
Let users flag problems the moment they hit them with [Bug Reports](/product/bug-reports), triggered by a device shake or a call to the SDK from your own button. Each report bundles device details, app version, network conditions and screenshots with the user's own words, with an easy link straight to the matching session timeline.
Skip the email threads and support ticket back-and-forth. Your users describe the issue and you get all the context you need to solve it.
## User Journeys
See the paths users take through your app with [User Journeys](/product/user-journeys). Every screen transition is mapped automatically into clear flow diagrams, and the exception view shows where issues interrupt those flows.
Short on time? See which paths matter most to your users so you can prioritize issues by user traffic.
## Network Monitoring
Watch every request your app makes with [Network Performance](/product/network-performance). Track HTTP status codes over time and drill into your top endpoints, ranked by latency, error rate and request volume, to find the calls slowing your app down.
Catch degraded endpoints early and tune the API calls that matter most to your users.
## Coding Agents
Bring all of Measure's context into the coding agents you already use. The [Measure MCP server](/product/mcp) gives any agent access to your crashes, errors, performance traces and session timelines, straight from your IDE, editor or terminal.
Have it dig into a crash, work through user sessions, or wire it into an agentic triage and debugging pipeline. Whether you lean on Claude Code or Codex, or prefer open source agents and models, Measure fits right into your workflow.
Works with Claude Code, Cursor, Codex, Gemini CLI, Windsurf, Cline, opencode and Kilo Code.
Get started:
---
Source: https://measure.sh/luciq-alternative
---
# Looking for Luciq alternatives?
Luciq (formerly Instabug) originally started with bug reporting but later expanded to become a full mobile observability platform.
Measure is a mobile first, open source Luciq alternative.
## Full session context on every issue
Measure and Luciq both record full session replays and attach logs, network calls, device details and repro steps to the issues you debug, giving you far more than a stack trace.
Measure captures gestures, navigation, network calls, lifecycle events and custom spans into a full [Session Timeline](/product/session-timelines) on every issue.
The key difference is transparency. With Measure, you can audit what happens to those collected sessions since our entire platform is open source. From the SDK to the backend processing and the storage layer, you can see what Measure does with your data and verify it yourself. No need for blind trust, just read the source.
## Adaptive capture, on your terms
Measure captures full session context by default, and with [Adaptive Capture](/product/adaptive-capture) you can tune what you collect remotely, without shipping an app update.
Luciq does not give you the same remote control to increase capture while you chase a tricky bug and then pull it back to keep cost and noise down.
Turn detail up on a new release, down afterwards, and change it whenever you need to.
## Fully open source
Luciq is proprietary. Its SDK is published on GitHub, but under a license that forbids modifying it (use as is, all rights reserved), and the backend and dashboard are a closed platform you can neither run nor inspect.
Measure is [fully open source](https://github.com/measure-sh/measure). Read it, run it, self-host it, audit the pipeline end to end, and if you think something can be done better, send a pull request.
## Simple, predictable pricing
Luciq charges per daily active user and per seat and requires a sales call to get a quote. App users without much activity end up adding to costs, and every team member who needs access to the dashboard increases costs further.
Measure has a single, transparent [price](/pricing) based on how much data you use. No per-seat fees, no per-user charges, no sales call needed. With [Adaptive Capture](/product/adaptive-capture) you can tune collection to keep costs in check.
## Built for mobile, by mobile devs
Luciq and Measure are both mobile first platforms. Luciq is closed source and proprietary.
Measure is open source and built in the open, with a public roadmap and issue tracker, made for mobile developers to read, participate and contribute. [Crashes & ANRs](/product/crashes-and-anrs), [App Health](/product/app-health), [Performance Traces](/product/performance-traces), [Network Performance](/product/network-performance), [Bug Reports](/product/bug-reports) and [User Journeys](/product/user-journeys) are all shaped by how mobile apps break in production.
Measure is built with the community, incorporating continuous feedback which we strongly believe leads to a better platform for mobile developers.
## Measure vs Luciq
| Capability | Measure | Luciq |
| --- | --- | --- |
| Crash reporting with full session timelines | ✓ | ✓ |
| ANR detection with full session timelines | ✓ | ✓ |
| Performance traces | ✓ | ✓ |
| Network monitoring | ✓ | ✓ |
| User journeys | ✓ | ✓ |
| In-app bug reports | ✓ | ✓ |
| Session timeline on every issue | ✓ | ✓ |
| Dynamic Sampling with Adaptive Capture | ✓ | ✗ |
| Auto-captured context | Gestures, navigation, network, lifecycle | Screen changes, interactions, network, logs |
| Pricing | Simple pricing based on data usage | Per active user + seat, sales call needed |
| Open Source | Apache 2.0 (OSI open source) | Proprietary |
| Self-hostable | ✓ | ✗ |
| Public roadmap & issue tracker | ✓ | ✗ |
| Mobile focus | ✓ | ✓ |
Get started:
---
Source: https://measure.sh/new-relic-alternative
---
# Looking for New Relic alternatives?
New Relic is a comprehensive, all-in-one observability platform spanning APM, infrastructure, logs, browser monitoring, synthetics and mobile.
Measure is a mobile first, open source New Relic alternative.
## Full session context on every issue
New Relic gives you stack traces, breadcrumbs and interaction traces, and optionally Mobile Session Replay with several sampling options.
Measure attaches a full [Session Timeline](/product/session-timelines) with gestures, navigation, network calls, lifecycle events and custom spans to every crash, ANR and error and you only pay for the data used as a whole.
The key difference is transparency. Measure is open source, the platform that stores your user data is transparent, and you never have to send your data to a proprietary, locked platform.
## Adaptive capture, not fixed sampling
New Relic offers several sampling strategies. Some of these are server controlled but changing other sample rates means shipping an app update with new SDK settings.
Measure captures full session context by default, and with [Adaptive Capture](/product/adaptive-capture) you can tune what you collect remotely, without shipping an app update.
Dial up on new releases or when chasing tricky production issues, dial down whenever you need to.
## Fully open source
New Relic open sources its mobile agents, but the backend and dashboard are proprietary. You can look into the SDK, but you can't see or run the platform that ingests and stores your data.
Measure is [fully open source](https://github.com/measure-sh/measure). Read it, run it, self-host it, audit the pipeline and if you think something can be done better, send a pull request.
## Simple, predictable pricing
New Relic charges on data ingest and user seats. This means adding teammates and ingesting more data both push the bill up.
Measure has a single, transparent [price](/pricing) based on how much data you use. No per-seat fees, no separate product meters. With [Adaptive Capture](/product/adaptive-capture) you can dial collection up or down without rolling out app updates to control your costs even better.
## Built for mobile, by mobile devs
New Relic monitors infrastructure, APM, logs, browser, synthetics, security and more across one expansive platform. Mobile is one surface among many, and the defaults, dashboards, product decisions and roadmap are shaped by the whole platform rather than by the needs of mobile devs alone.
Measure is built only for mobile. [Crashes & ANRs](/product/crashes-and-anrs), [App Health](/product/app-health), [Performance Traces](/product/performance-traces), [Network Performance](/product/network-performance), [Bug Reports](/product/bug-reports) and [User Journeys](/product/user-journeys) are all designed around how mobile apps actually break in production.
Mobile is not a part of our product, it is the whole product.
## Measure vs New Relic
| Capability | Measure | New Relic |
| --- | --- | --- |
| Crash reporting with full session timelines | ✓ | Crash reports with optional Session replays |
| ANR detection with full session timelines | ✓ | ANRs with optional Session replays |
| Performance traces | ✓ | ✓ |
| Network monitoring | ✓ | ✓ |
| User journeys | ✓ | ✓ |
| In-app bug reports | ✓ | ✗ |
| Session timeline on every issue | ✓ | Session replay, sampled |
| Dynamic Sampling with Adaptive Capture | ✓ | Sampled, partial remote control |
| Auto-captured context | Gestures, navigation, network, lifecycle | Interactions, network, handled exceptions, breadcrumbs |
| Pricing | Simple pricing based on data usage | Per-GB data ingest plus per-user seats |
| Open Source | Apache 2.0 (OSI open source) | SDKs only |
| Self-hostable | ✓ | ✗ |
| Public roadmap & issue tracker | ✓ | SDK repos only |
| Mobile focus | ✓ | One small part of a huge platform |
Get started:
---
Source: https://measure.sh/pricing
---
# Pricing
Simple pricing based on the data used. No stressing over seat limits. No need to buy artificial bundles of crashes and spans - just track what you need to get to the root cause faster.
## Free — $0 per month
- 5 GB per month
- 30 days retention
- No credit card needed
## Pro — $50 per month
- 25 GB per month included
- 90 days retention
- Extra data charged at $2.00 per GB/month
Control costs with [Adaptive Capture](/product/adaptive-capture) · No Seat Limits · No Artificial Bundles
Get started:
---
Source: https://measure.sh/product/adaptive-capture
---
# Adaptive Capture
Most monitoring data is never read but ends up inflating your costs 💰. Adaptive Capture lets you capture what matters based on changing needs.
Need more data during a product launch or incident? Simply tweak your collection parameters to capture additional context when it matters most and collect only the essentials when things are running smoothly.
The best part? No need to roll out app updates! When you change your captures settings, our servers propagate the changes to our SDK seamlessly.
No more worrying about bloated costs or wasted data, Adaptive Capture lets you get the data you need, when you need it.
Get started:
---
Source: https://measure.sh/product/app-health
---
# App Health
Keep your finger on the pulse of your app's performance with comprehensive health monitoring that goes beyond the basics.
App Health gives you fast insights into the metrics that matter most - from error rates, error rates as perceived by users, app adoption and app size to precise launch time measurements across cold, warm and hot starts.
With App Health, you can proactively identify and address performance issues before they impact your users leading to a smooth rollout every time.
Get started:
---
Source: https://measure.sh/product/bug-reports
---
# Bug Reports
Empower your users to report issues directly from your app with a device shake or using your own custom button.
Bug Reports automatically capture everything that matters - device information, app version, network conditions and the exact timestamp alongside the user's description and screenshots.
Every bug report links directly to the complete session timeline, so you can see exactly what the user experienced, review the sequence of events and identify the root cause without stumbling around in the dark.
Bug Reports allows you to skip the email threads, support tickets and the back-and-forth asking users to remember what they were doing - your users describe the problem in their own words and you get all the technical data you need to solve it.
Get started:
---
Source: https://measure.sh/product/crashes-and-anrs
---
# Crashes and ANRs
Get instant visibility into every exception with detailed crash reports that include full stack traces, device information, OS versions and intelligent analysis of the sequence of user actions that led to the failure.
Our Common Path feature reconstructs the user journey before each crash, showing you what screens they visited, which actions they took, what API calls were and several other important signals.
Path analysis combined with comprehensive stack traces and thread-level details, gives you everything you need to reproduce issues effectively and ship fixes with confidence.
Get started:
---
Source: https://measure.sh/product/mcp
---
# MCP
Connect Measure with your favorite coding agents through the Model Context Protocol.
MCP lets AI coding assistants like Claude, Codex and Gemini access your errors, performance traces, session timelines and bug reports directly in your development workflow.
With MCP, you can simply ask your AI assistant to look up an error, get the full context including stack traces and session timelines leading to the issue and harness the power of AI to ship fixes faster than ever before.
Get started:
---
Source: https://measure.sh/product/network-performance
---
# Network Performance
Monitor the health and performance of every network request your app makes. Instantly see HTTP status code distributions over time, giving you a clear picture of how your API layer is performing at a glance.
Drill into your top endpoints ranked by latency, error rate and request frequency to pinpoint exactly which calls are slowing down your app or failing silently. Visualize when specific endpoints are called during a session to understand request patterns and timing.
With Network Performance, you can proactively catch degraded endpoints, reduce error rates and optimize the API calls that matter most to your users.
Get started:
---
Source: https://measure.sh/product/performance-traces
---
# Performance Traces
Measure exactly what matters for your app's user experience by instrumenting critical operations in your codebase.
Performance traces let you understand how API fetches, complex code operations and UI rendering stack up within a single user flow or aggregate across millions of sessions, with waterfall charts that make bottlenecks immediately obvious.
Every trace includes rich context such as device type and network conditions and links to a full session timeline so you can spot patterns and correlate slowdowns within specific environments.
Whether you're reducing checkout time, speeding up content loading or improving screen transitions, Performance Traces give you the quantitative data you need to make precise improvements.
Get started:
---
Source: https://measure.sh/product/session-timelines
---
# Session Timelines
Debug issues faster by replaying the exact sequence of events that led to a crash or performance problem.
Session Timeline captures the complete story - see which API call failed, what the user clicked right before an error occurred and how your app's resources were behaving at that precise moment.
With Session Timelines, you can stop guessing and have the full context you need to identify and fix root causes in an easy-to-navigate timeline.
Get started:
---
Source: https://measure.sh/product/user-journeys
---
# User Journeys
See the full picture of user behavior with beautiful flow diagrams that reveal the actual paths users take through your app.
User Journeys automatically map every screen transition, showing you which flows are most popular, where users drop off and which navigation patterns you never anticipated. Easily add your own screens and views to enrich them further.
Toggle between normal path analysis and exception view to see exactly where crashes and ANRs interrupt user flows. If users consistently crash when navigating from Product List to Product Detail screens, you'll see it highlighted with crash counts and session volumes. Click any path or exception to drill into the details and investigate further.
Whether you're redesigning navigation, prioritizing feature work or debugging issues in conversion funnels, User Journeys transforms complex behavioral data into clear, actionable visualizations that help you build better experiences.
Get started:
---
Source: https://measure.sh/security
---
# Security
At Measure, we recognize that security is fundamental to the trust placed in our open-source software and Measure Cloud (our managed SaaS offering).
Security is a core priority throughout the development, deployment and maintenance of our systems, and we adhere to established industry best practices to safeguard code, data and operations.
This policy outlines the principles, standards and controls that guide our commitment to maintaining the confidentiality, integrity and availability of our software, infrastructure and services.
## Open Source Transparency
Measure is fully open-source, and its source code is publicly available on [GitHub](https://github.com/measure-sh/measure). This transparency allows continuous review by the open-source community, fostering early identification and remediation of potential security issues.
## Supply Chain Security
Dependencies are regularly audited through GitHub [Dependabot](https://github.com/measure-sh/measure/security/dependabot) and code scanning tools, including [secret scanning](https://github.com/measure-sh/measure/security/secret-scanning), to detect and address vulnerabilities promptly. We ensure timely updates to dependencies to mitigate risks. An up-to-date [Software Bill of Materials](https://github.com/measure-sh/measure/network/dependencies) (SBOM) is maintained, and users are encouraged to inspect or export it for their own assessments.
## Authentication & Authorization
**Open Source (Self Hosted)**: Authentication and authorization are provided via Google and GitHub OAuth 2.0 protocols, strictly following the latest version of the [OAuth](https://oauth.net/specs/) standards. We use JSON Web Tokens (JWT) with a short expiry to minimize potential exploitation. We do not ask for or store user passwords, eliminating password-based vulnerabilities. Database credentials for Postgres and ClickHouse are generated using cryptographically secure algorithms via OpenSSL, unique to each installation. All communications with the software should be conducted over secure channels (TLS 1.2 or higher) when exposing APIs externally.
**Measure Cloud**: Authentication is managed centrally, with the same OAuth 2.0 and JWT standards applied. Infrastructure and secret management follow cloud security best practices, including encryption at rest and in transit. All Measure APIs use TLS 1.2 or higher for encryption in transit to protect data integrity and confidentiality. Private keys and sensitive credentials are securely stored and managed using [Google Secret Manager](https://cloud.google.com/security/products/secret-manager). Role-based access controls and centralized key management are enforced.
## Data Security
**Open Source (Self Hosted)**: Measure does not process or store sensitive customer data by design. All data is stored within the user's infrastructure. Users are responsible for performing security assessments and implementing safeguards appropriate to their environment.
**Measure Cloud**: Customer data is processed and stored within Measure Cloud infrastructure, hosted on Google Cloud Platform. All Google Cloud Storage (GCS) buckets are encrypted at rest using Google-managed encryption keys with the **AES-256** algorithm. Data in transit, including API requests and responses, is encrypted using **TLS 1.2** or higher. We apply strict access controls, monitoring and regular security reviews to ensure data security. Our architecture follows the principle of least privilege and enforces separation between customer environments. Measure Cloud adheres to Google's security best practices, as outlined in the [Google Cloud Security Best Practices Center](https://cloud.google.com/security/best-practices).
## Data Retention
**Session Data**: All session-related data is retained only according to the user-configured application data retention settings in the Measure Dashboard. Users have full control over retention periods for their applications.
**Crash and ANR Metadata**: We retain minimal crash and ANR (Application Not Responding) metadata solely to facilitate the identification and resolution of recurring issues in future application sessions. This data is anonymized and does not contain personally identifiable information (PII) by design.
## Monitoring for Performance & Reliability
We continuously monitor the health, availability and performance of our software using industry-standard observability tools to ensure operational reliability. Monitoring is designed to detect and address potential security issues proactively. Collected data does not include customer application data or personally identifiable information (PII) by design and is used solely to maintain performance, stability and security.
## Vulnerability Reporting
We encourage responsible disclosure of security vulnerabilities via [GitHub's Security Advisory](https://github.com/measure-sh/measure?tab=security-ov-file) process. Potential security issues may also be reported by emailing for prompt investigation and remediation.
Get started:
---
Source: https://measure.sh/sentry-alternative
---
# Looking for Sentry alternatives?
Sentry is a popular error monitoring tool with roots in the web dev world. Mobile support is a more recent expansion to the core error monitoring platform.
Measure is a mobile first, open source Sentry alternative.
## Full session context on every issue
Sentry gives you stack traces and breadcrumbs out of the box with Session Replays billed separately. If you want full context on every error, you will need to turn on Session Replays for all of them and accommodate the considerable cost increase.
Measure attaches a full [Session Timeline](/product/session-timelines) with gestures, navigation, network calls, lifecycle events and custom spans to every crash, ANR and error and you only pay for the data used as a whole.
You see exactly what the user did and what the app did, on every issue, without any compromise on the context.
## Adaptive capture, not fixed sampling
Sentry uses client-side sampling. You set a sample rate for traces and replays and decide up front what fraction to keep.
Measure captures full session context by default, and with [Adaptive Capture](/product/adaptive-capture) you can tune what you collect remotely, without shipping an app update.
Dial up sample rates on new releases or when chasing tricky production issues, dial down whenever you need to.
## Fully open source
Sentry uses a custom source-available rather than OSI open source: its main application and dashboard ship under the Functional Source License (FSL) with only the SDKs being MIT and the main application only going Apache 2.0 after 2 years.
Measure is [fully open source](https://github.com/measure-sh/measure). Read it, run it, self-host it, audit the pipeline and if you think something can be done better, send a pull request.
## Simple, predictable pricing
Sentry bills across a range of separate features: errors, spans, replays all cost different amounts across various tiers which makes it harder to predict costs as your app scales up.
Measure has a single, transparent [price](/pricing) based on how much data you use. No per-seat fees, no separate product meters. With [Adaptive Capture](/product/adaptive-capture) you can dial collection up or down without rolling out app updates to control your costs even better.
## Built for mobile, by mobile devs
Sentry monitors servers, cloud, serverless, frontend, games and mobile across dozens of SDKs. Mobile is one platform among many, and the defaults, platform decisions, dashboards and product roadmap are shaped by the whole platform rather than by the needs of mobile devs alone.
Measure is built only for mobile. [Crashes & ANRs](/product/crashes-and-anrs), [App Health](/product/app-health), [Performance Traces](/product/performance-traces), [Network Performance](/product/network-performance), [Bug Reports](/product/bug-reports) and [User Journeys](/product/user-journeys) are all designed around how mobile apps actually break in production.
Mobile is not a part of our product, it is the whole product.
## Measure vs Sentry
| Capability | Measure | Sentry |
| --- | --- | --- |
| Crash reporting with full session timelines | ✓ | Crash reports with breadcrumbs, Session replay billed separately |
| ANR detection with full session timelines | ✓ | ANRs with breadcrumbs, Session replay billed separately |
| Performance traces | ✓ | ✓ |
| Network monitoring | ✓ | ✓ |
| User journeys | ✓ | ✗ |
| In-app bug reports | ✓ | ✓ |
| Session timeline on every issue | ✓ | Session Replay billed separately |
| Dynamic Sampling with Adaptive Capture | ✓ | Client side only sampling |
| Auto-captured context | Gestures, navigation, network, lifecycle | Breadcrumbs, deeper context via Replay |
| Pricing | Simple pricing based on data usage | Separate quotas for errors, spans, replays, profiling, cron, uptime & logs |
| Open Source | Apache 2.0 (OSI open source) | FSL — source-available, Apache 2.0 after 2 years |
| Self-hostable | ✓ | ✓ |
| Public roadmap & issue tracker | ✓ | ✓ |
| Mobile focus | ✓ | One of many Sentry platforms |
Get started:
---
Source: https://measure.sh/why-measure
---
# Why Measure?
There are several mobile app monitoring tools in the market. What is different between these tools is the core philosophy of the teams building them which affects the products in small and large ways.
## Beyond Crashes
Measure is focused on giving the full picture of apps in production to mobile developers and is not just limited to basic error tracking.
With advanced automated capture techniques and full [Session Timelines](/product/session-timelines), Measure allows you to get the full context of errors and performance issues as they happen in the wild.
If you're looking to truly understand what issues occur in your app, how they impact users and how to debug them quickly, Measure is the right tool for you.
## Mobile Focus
Measure is built by mobile developers for mobile developers. Every feature, every design decision and every trade-off is made with mobile app production monitoring in mind.
Mobile is not an add-on or afterthought to an observability product, it **is** the product.
If you care about your app being treated with the respect and focus it deserves, Measure is the perfect match for you.
## Open Source
Measure is [fully open source](https://github.com/measure-sh/measure). This means our code is open to scrutiny and community contributions which we strongly believe leads to a better product.
If you value transparency, flexibility and open development, Measure is the right community for you.
## Simple Pricing
Measure offers clear and transparent [pricing](/pricing) based on data and retention. There are no bundles, hidden charges, seats or tiers (although we do offer discounts for high volume apps). You can send any combination of errors, metrics, spans etc without worrying about exceeding artificial limits.
Further, with [Adaptive Capture](/product/adaptive-capture), you can optimize your data collection to only capture what you need and adjust it dynamically without rolling out app updates, reducing costs and data bloat.
If you hate playing with excel sheets and pricing calculators to figure out your monthly bill and would like to adjust your data collection based on changing needs, Measure is the right choice for you.
Get started: